Sampling Distribution Worksheet: Central Limit Theorem
advertisement

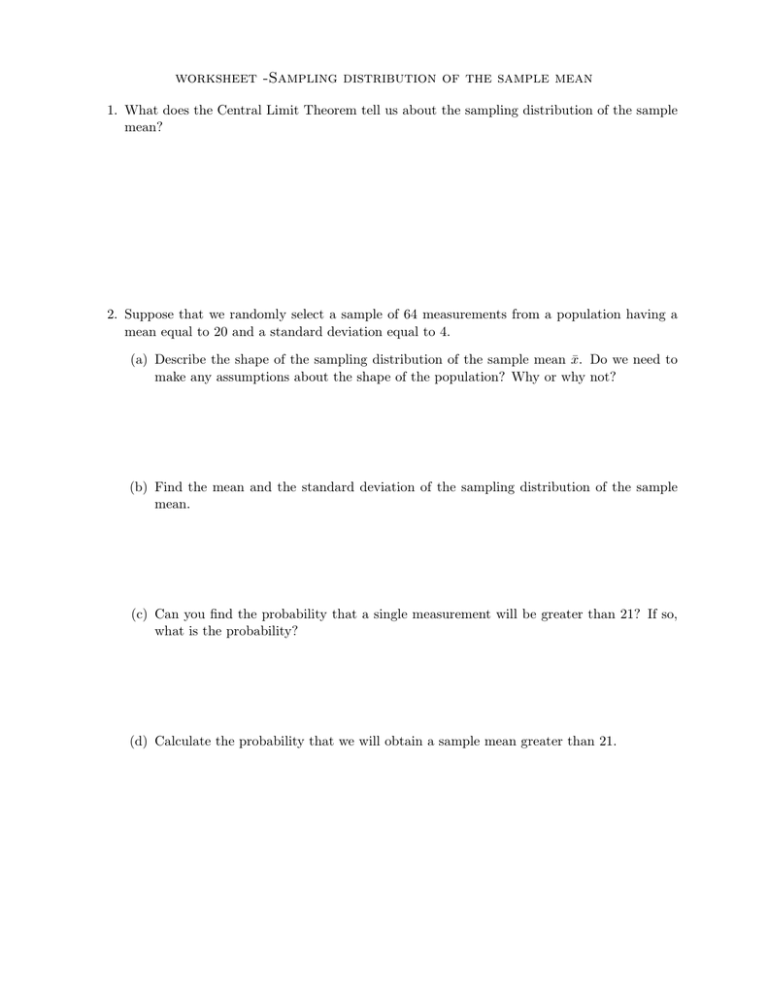
worksheet -Sampling distribution of the sample mean 1. What does the Central Limit Theorem tell us about the sampling distribution of the sample mean? 2. Suppose that we randomly select a sample of 64 measurements from a population having a mean equal to 20 and a standard deviation equal to 4. (a) Describe the shape of the sampling distribution of the sample mean x̄. Do we need to make any assumptions about the shape of the population? Why or why not? (b) Find the mean and the standard deviation of the sampling distribution of the sample mean. (c) Can you find the probability that a single measurement will be greater than 21? If so, what is the probability? (d) Calculate the probability that we will obtain a sample mean greater than 21. 3. Hospitalization length. The average length of a hospital stay in the US is µ = 9 days with standard deviation of σ = 3 days. Assume a simple random sample of 100 patients is obtained and the mean stay for 100 patients is obtained. What is the probability that the average length of stay for this group of patients will be less than 9.6 days? To answer this question, we usually think of the following steps: (a) What is the mean of the sampling distribution of x̄ for samples of size 100. (b) What is the standard deviation of the sampling distribution of x̄ for samples of size 100. (c) What is the probability to obtain a sample mean less than 9.6 days? 4. ACT scores. The scores of students on the ACT college entrance examination in a recent year had a Normal distribution. with mean µ = 18.6 and a standard deviation of σ = 5.9. (a) What is the probability that a single student randomly chosen from all those taking the test scores 21 or higher? (b) Now take a simple random sample of 50 students who took the test. What are the mean and standard deviation of the sample mean score x̄ of these 50 students? (c) What is the probability that the mean score of these students is 21 or higher? 5. Personal income. The Annual Demographic Supplement to the current Population Survey interviewed more than 128,000 people in March 2001. The Census Bureau reports that the mean income of the Hispanic males interviewed was $22,771. The mean income for the nonHispanic white males interviewed was $41,798. Is each of the bold numbers a parameter or a statistic? 6. Auto accidents. The number of accidents per week at a hazardous intersection varies with mean µ = 2.2 and standard deviation σ = 1.4. This distribution only takes whole-number values, so it is certainly not Normal. (a) Let x̄ be the mean number od accidents per week at the intersection during a year (52 weeks). What is the approximate distribution of x̄ according to the Central Limit Theorem? (b) What is the approximate probability that x̄ is less than 2? (c) What is the approximate probability that there are fewer than 100 accidents at the intersection in a year? (Hint: Restate this event in terms of x̄.) 7. Posting fees. Weekly postage expenses for your company have a mea of $325 and a standard deviation of $54. Your company has allowed for $350 postage per week in its budget. (a) What is the probability that the average weekly postage expenses for the past 9 months (assume each month has 4 weeks) exceed the budgeted amount of $350? (b) The recent problems with the stock market are affecting your business and you need to reallocate some of your funds, so you’d like to reduce your postage expenses. What is the probability that your postage for the next week will not exceed $330?


