Chapter 5 Airline Operating Costs and Measures of Productivity
advertisement

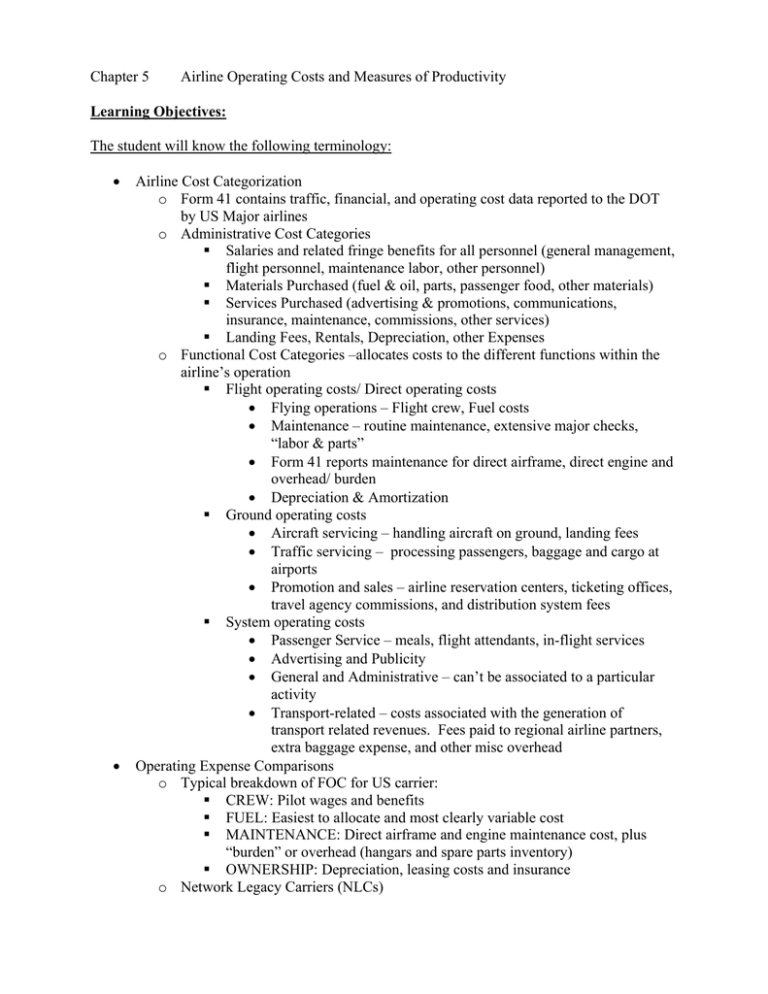
Chapter 5 Airline Operating Costs and Measures of Productivity Learning Objectives: The student will know the following terminology: • • Airline Cost Categorization o Form 41 contains traffic, financial, and operating cost data reported to the DOT by US Major airlines o Administrative Cost Categories Salaries and related fringe benefits for all personnel (general management, flight personnel, maintenance labor, other personnel) Materials Purchased (fuel & oil, parts, passenger food, other materials) Services Purchased (advertising & promotions, communications, insurance, maintenance, commissions, other services) Landing Fees, Rentals, Depreciation, other Expenses o Functional Cost Categories –allocates costs to the different functions within the airline’s operation Flight operating costs/ Direct operating costs • Flying operations – Flight crew, Fuel costs • Maintenance – routine maintenance, extensive major checks, “labor & parts” • Form 41 reports maintenance for direct airframe, direct engine and overhead/ burden • Depreciation & Amortization Ground operating costs • Aircraft servicing – handling aircraft on ground, landing fees • Traffic servicing – processing passengers, baggage and cargo at airports • Promotion and sales – airline reservation centers, ticketing offices, travel agency commissions, and distribution system fees System operating costs • Passenger Service – meals, flight attendants, in-flight services • Advertising and Publicity • General and Administrative – can’t be associated to a particular activity • Transport-related – costs associated with the generation of transport related revenues. Fees paid to regional airline partners, extra baggage expense, and other misc overhead Operating Expense Comparisons o Typical breakdown of FOC for US carrier: CREW: Pilot wages and benefits FUEL: Easiest to allocate and most clearly variable cost MAINTENANCE: Direct airframe and engine maintenance cost, plus “burden” or overhead (hangars and spare parts inventory) OWNERSHIP: Depreciation, leasing costs and insurance o Network Legacy Carriers (NLCs) • • More Traditional Airlines Operate large hub-and-spoke networks Regional, Domestic and International Service Big Six (American, United, Delta, Northwest, Continental, US Airways/ America West) o Low-Cost Carriers (LCCs) Operate smaller networks High proportion of point-to-point or non-hub Reduced levels of service and low fares Southwest, AirTran, Frontier, ATA, JetBlue, Spirit o Characteristics of all or at least most LCCs Fleet Commonality – reduces the costs of spare parts, maintenance and crew training Point-to-Point instead of connecting hub networks – reduces costs of handling connecting passengers and improves productivity of both aircraft and crews No labor unions and lower wages – higher productivity due to less restrictive work rules Single cabin/ class service – reduces complexity and costs Open seating – less time processing passengers and no boarding passes, improves productivity and reduces costs Reduced Frills – less seating space, no food and no beverages , increases ASM and reduces passenger service cost No frequent-flyer programs – reduces administrative costs Avoids traditional distribution channels – no travel agencies, no commissions, tickets directly from airline (website or phone) Comparison of Airline Unit Costs o Legacy vs. Low-Cost Airlines Unit Costs Fuel expenses are compared under assumptions all airlines are subject to the same fuel price environment (They are not) Fuel price hedging Both NLC and LCC experienced a drop in unit costs after 2001 and a rise in unit costs after 2004 NLC’s drop reflects cost-cutting strategies put in place after 9/11 (employee layoffs and passenger service cutbacks) NLC’s rise in costs primarily due to fuel prices LCC’s rise in costs tempered by their capacity growth during the same period Measures of Airline Productivity o Aircraft Productivity Measured in ASMs generated per aircraft per day: = (# departures) X (average stage length) X (# seats) Aircraft “utilization” measured in block-hours/day: • Block hours begin at door close (blocks away from wheels) to door open (blocks under wheels) • Gate-to-gate time, including ground taxi times Increased aircraft productivity achieved with: • More flight departures per day, either through shorter turnaround (ground) times or off-peak departure times • Longer stage lengths (average stage length is positively correlated with increased aircraft utilization = block hours per day) • More seats in same aircraft type (no first class seating and/or tighter “seat pitch”) o Labor Productivity Measured in ASMs per employee per period As with aircraft, employee productivity should be higher with: • Longer stage lengths (amount of aircraft and traffic servicing for each flight departure not proportional to stage length) • Larger aircraft sizes (economies of scale in labor required per seat for each flight departure) • Increased aircraft productivity due to shorter turnaround times (more ASMs generated by aircraft contribute to positive employee productivity measures) Yet, network airlines with long stage lengths and large aircraft have lower employee productivity rates o Airline Productivity Measures Aircraft Productivity • Aircraft Utilization (block-hours per day) • ASMs per Aircraft per Day • Average Stage Length • Number of Departures per Day • Aircraft Capacity (seats per aircraft) Employee Productivity • ASMs per Employee • ASMs per Labor Dollar • Revenue per Employee, • Revenue per Labor Dollar The student will be able to perform the following analysis (i.e. problems): • Able to calculate: o Flight operating costs Per Block Hour o Aircraft Servicing Costs Per Aircraft Departure o Traffic Servicing Costs Per Enplaned Passenger o Passenger Servicing Costs Per RPM o Able to calculate Airline Productivity Measures Aircraft Productivity • Aircraft Utilization (block-hours per day) • ASMs per Aircraft per Day • Average Stage Length • Number of Departures per Day • Aircraft Capacity (seats per aircraft) Employee Productivity • • ASMs per Employee • ASMs per Labor Dollar • Revenue per Employee, • Revenue per Labor Dollar Discuss Legacy (NLC) versus Low Cost Carrier (LCC) o Operational Strategies and how they affect unit cost o Characteristics and how they affect unit cost


