Design of a Sustainable Oyster Aquaculture Business for the West
advertisement
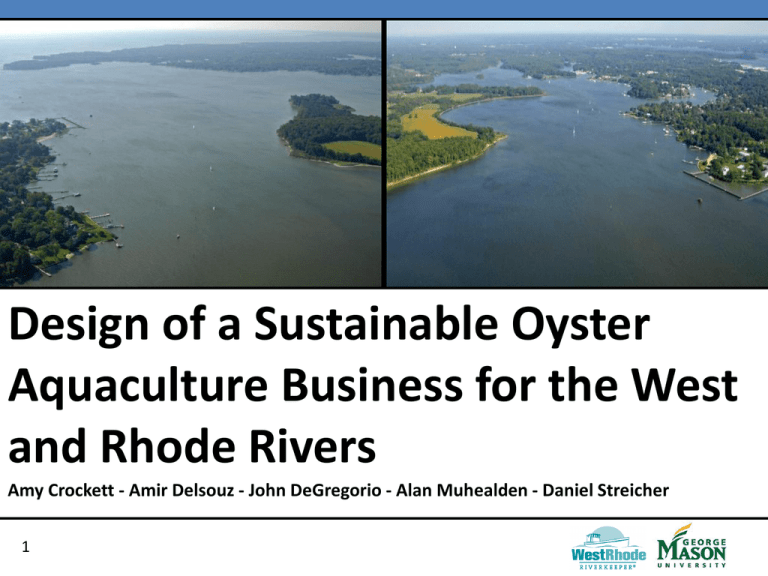
Design of a Sustainable Oyster Aquaculture Business for the West and Rhode Rivers Amy Crockett - Amir Delsouz - John DeGregorio - Alan Muhealden - Daniel Streicher 1 Agenda • • • • • • • 2 Context Problem/Need Statement Design Evaluation Design Alternatives Simulation and Modeling Recommendations Project Plan West and Rhode Rivers (WRR) • • Two sub-estuaries of the Chesapeake Bay Contain approximately 53 million cubic meters of water, average depth is 2 meters. Watershed covers 78 square kilometers (J. Askvig et al. 2011) • Fairfax Chesapeake Bay 3 Rhode West Current Water Quality of WRR INDICATOR Water Clarity/ Secchi Depth THRESHOLD WEST RIVER % of samples RHODE RIVER % of samples GRADE AVERAGE >1m 30% 30% D > 5 mg/L 73% 92% A- < 0.65 mg/L < 0.037 mg/L 47% 46% C Chlorophyll < 6.2 μg/L 47% 40% C- Underwater Grasses > 1.2 km² 0% 0% F Dissolved Oxygen Nutrients (N/P) Data Source: West/Rhode Riverkeeper Report Card 2011 4 Eutrophication Process Excess Nutrients Algae Bloom Increased Turbidity SAV* Growth Prevented Hypoxic Conditions Aquatic Species Mortality 5 Data Source: West/Rhode Riverkeeper Report Card 2011 * SAV = Sub Aquatic Vegetation Previous Research • Previous project established three alternatives to decrease turbidity and increase SAV growth • Recommended the clams as solution Source: J. Askvig et al 2010 [1] 6 Previous Research - Cont. Outcome of Project • Clams planted in Rhode River as a pilot project by Smithsonian Environmental Research Center Summer 2011 • All of the clams died: close to survivability limits (Gedan, 2011) Review and Analysis of Project • Unlike clams, oysters are known to be more resilient to varying salinity and dissolved oxygen conditions; propose to use oysters in order to improve water quality. • Due to low probability of reproduction, oysters can also be artificially sustained through aquaculture; propose to use aquaculture program as method of implementation. 7 Salinity Tolerance 18 Data taken from Rhode River, site WT8.2 y = -0.0002x + 16.096 R² = 0.0188 Salinity (1984 - 2011) Salinity Salinity 16 Clam Threshold Shellfish Threshold 14 Oyster Threshold Linear (Salinity) Salinity (ppt) 12 10 8 6 4 2 0 O-84 J-87 A-90 J-93 O-95 J-98 Date (month/year) Data Source: Maryland Department of Natural Resources 8 M-01 D-03 S-06 J-09 Agenda • • • • • • • 9 Context Problem/Need Statement Design Evaluation Design Alternatives Simulation and Modeling Recommendations Project Plan Problem/Need Statement The WRR has seen decreased water quality due to increased nutrients and sediment from runoff and is exacerbated by loss of Sub-Aquatic Vegetation (SAV) and other aquatic resources. Oysters have been proven to remove excess nutrients and sediment and restore the health of the rivers. Currently, the budget climate prevents prolonged government funding to support a sustainable aquaculture system. There is a need for an oyster aquaculture system in the West and Rhode Rivers to reduce nutrients and sediment and to be financially sustaining, with a positive return on investment within 5 years. 10 Scope • Simulation of oyster growth rate within the varying environment of the West and Rhode Rivers. • Simulation of an oyster aquaculture business plan. • Simulation of oyster filtration rate on nutrient levels in the West and Rhode Rivers. • Business plan for implementation 11 Primary Stakeholders Stakeholders Objectives Tensions West and Rhode River Keeper Supports reducing pollution, enforcing environmental law, promoting restoration, and advocating for better environmental quality. Maryland Watermen’s Association Supports harvesting and sale Main priority is making profit of aquatic species from river. throughout the year. Maryland Department of Natural Resources Supports management of regional watershed, which includes streams, coastal bays, and the Chesapeake Bay. Limited amount of funding available for restoration projects. Local Watershed Residents Supports recreational use of river and waterfront property use. Source of waste runoff and nutrient pollution. 12 Monitors water quality and promotes restoration practices, though limited in resources for implementing sustainable plans. Stakeholder Relationship Diagram Consumers Pays Taxes Aquaculture Market Market Revenue Waste Runoff Recreation Market Sales Harvests Resources Supplies Aquaculture Watermen West and Rhode Rivers Residents Informs and Promotes Restoration Supports and Funds W/R Riverkeeper Supports and Monitors Pays Taxes Supports Conservation Support Aquaculture and Regulates Licenses 13 MDDNR Advocates Policy Change Reinforcement Loop Agenda • • • • • • • 14 Context Problem/Need Statement Design Evaluation Design Alternatives Simulation and Modeling Recommendations Project Plan Proposed Cage Design (Side View) • Oysters placed on river bed: • Require a hard substrate (recycled shell) to set on • This is costly and scarce • Filter only the bottom depths of the water • Hanging Cage Design: • Does not require recycled shell • Filters the entire water column Source: D. Fredriksson et al. 2010 [27] 15 Proposed Cage Design (Top View) • Maximum Capacity – 5 lines/acre – 750 trays/acre – 2.25 million 3” oysters/acre 16 Permitting Restrictions – Must be 300 feet from navigation buoys – Must be 150 feet from active pound nets – Must leave channel for boat navigation – Must have public approval/approval of adjacent landowners 17 Permitting – West River Current permits and restrictions make aquaculture in the West River infeasible at this time MDNR, 2012 18 Permitting – Rhode River Use the West River as a control to compare the effects of oyster filtration on the Rhode River MDNR, 2012 19 Proposed Site Permitting – Proposed Site at 1 Acre 20 Agenda • • • • • • • 21 Context Problem/Need Statement Design Evaluation Design Alternatives Simulation and Modeling Recommendations Project Plan Design Alternatives Initial Grow-out Method Final Product for Sale Using native Eastern Oysters 1)Remote Setting A) Half-Shell B) Shucked Larvae 2)Nursery Seed 3) Spat-on-Shell ~2 weeks (Maryland Sea Grant, 2011) 22 Market Size Oyster 2-3 Years Spat on Shell Design Alternatives Final Product Initial Grow-Out Remote Setting 1 day Soak Cultch Costs Recycled Shell 23 10 days Obtain Larvae from Hatchery Costs Larvae Combine Larvae in Tank Costs Facility Labor Equipment Tank Blower Pump Plumbing Shell-washer Cage Sort Oysters Costs Sorting Machine Plant Oysters in River Design Alternatives Final Product Initial Grow-Out Nursery 2 days Place Seed Into Weller Costs Micro-cultch Wellers Water Treatment Equipment 24 21 days Downwelling Costs Algae Upwelling Costs Bottom mesh cleaned daily Sort by Size & move to bigger mesh Algae Plant Oysters in River Design Alternatives Initial Grow-Out Final Product Spat-on-Shell Transportation Time Obtain Spat on Shell Costs Labor Transportation 25 Plant Oysters in River Design Alternatives Initial Grow-Out Final Product Shuck Oysters Harvest Oysters Costs Labor Transportation 48 Hours Costs Transportation Prepare Half Shell Oysters Costs Labor Marketing Labels 26 Agenda • • • • • • • 27 Context/Stakeholder Analysis Problem/Need Statement Design Evaluation Design Alternatives Simulation and Modeling Recommendations Project Plan/Budget Method of Analysis Environmental Variables # of Oysters # of Oysters Initial Investment 2DTMM Nutrients Removed # of Market Size Oysters Growth Model Business Model ROI Utility Function Cost Grow Out Stage Simulation Timeline 2DTMM = Two Dimensional Tidal Mixing Model (From Previous Project) 28 Analysis Initial Investment Overview Investment Parameters • Max Operating Capacity (in millions of oysters) • Operating Duration (in years) Default Simulation • Max Operating Capacity = 1.0 million oysters • Operating Duration = 5.0 years 29 Growth Model Overview Assumptions Inputs Stochastic Environmental Variables Outputs Mortality Stochastic Variable Oyster Biomass Input 30 Biometric Variables Growth Rate Oyster Biomass Output Growth Model Overview Assumptions Inputs Outputs • Oyster mortality due to harvest and disease will be negligible. Only predation and hypoxia will be considered. • Initial oyster biomass will be based on a log-normal distribution (μ=0.65, σ=0.63), approximating the mass of the oyster after the initial grow-out phase. • Oysters will be assumed to be market size once they have reached 76.2 mm in length, or approximately 0.33 kg Carbon. 31 Growth Model Overview Assumptions Inputs Outputs Stochastic Environmental Variables • Values are generated based on a Gaussian distribution. • μ/σ values based on MDDNR Water Quality Data. • 12 total distributions (dependent on month) January Values. Data from 1984-2011 Variable Units Average Standard Deviation Temperature C elsius 2.63 2.06 Dissolved Oxygen mg/L 12.00 0.82 Salinity ppt 12.29 0.58 Total Suspended Solids mg/L 3.40 1.98 Particulate Organic C arbon mg/L 0.95 1.37 32 Growth Model Overview Assumptions Inputs Outputs Biometric Variables • • • • • Fraction Ingested – % TSS used for oyster growth. Basal Metabolic – Passive respiration (% biomass/day) Respiratory Fraction – Active respiration (% assimilated) Assimilation Efficiency – % TSS used completely Mortality Rate – Total mortality (% biomass/day) Variable Unit Value Fraction Ingested IF 0.0 ≤ IF ≤ 1.0 0.12 Basal Metabolic BM d^(-1) 0.008 Respiratory Fraction RF 0.0 ≤ RF ≤ 1.0 0.1 Assimilation Efficiency α 0.0 ≤ α ≤ 1.0 0.77 Mortality Rate β d^(-1) 0.0026 Values determined through previous research (C. Cerco, 2007) 33 Growth Model Overview Assumptions Inputs Outputs Oyster Biomass • Total weight of oysters measured in kg Carbon ΔO • = (α * Fr * POC * IF(1-RF) * O) – (BM * O – β * O) 𝑑𝑡 Source: C. Cerco 2007 [5] 34 Variable Unit Oyster Biomass O Particulate Organic C arbon POC Filtration Rate FR Fraction Ingested IF Basal Metabolic BM Respiratory Fraction RF Assimilation Efficiency α Mortality Rate β Growth Model Overview Assumptions Inputs Outputs Filtration Rate • Fr = f(WT) * f(TSS) * f(S) * f(DO)*Frmax • Frmax = 0.55 m3 g-1 oyster carbon d-1 1.20 Source: C. Cerco 2007 [5] 35 5 7 9 11 13 15 17 19 21 23 25 27 29 31 0.0 1.0 Water Temperature (C) -1 2.0 3.0 4.0 5.0 6.0 7.0 8.0 9.0 10.0 11.0 Salinity (ppt) F(WT) F(S) 1.2 1.2 DO (mg/L) F(DO) 4. 8 4. 5 0 4. 2 0.2 0 3. 9 0.4 0.2 3. 6 0.6 0.4 3 0.6 3. 3 1 0.8 2. 7 1 0.8 2. 4 0.1 when TSS > 100 g m-3 3 2. 1 0.2 when 25 g m < TSS < 100 g m -3 0 1 1. 2 -3 0.2 0.00 0. 9 1.0 when 5 g m-3 < TSS < 25 g m -3 0.4 0.20 0. 6 0.1 when TSS < 5 g m -3 0.6 0.40 0 ì ï ïï f (TSS) = í ï ï ïî ) 0.60 0. 3 ( f (DO) = 1+ exp ( 3.67× ( 1.0 - DO ) ) 0.8 1. 8 f (S) = 0.5× (1+ tanh(S - 7.5)) 1 0.80 1. 5 f(WT) = exp(-0.015 × (T-27) ) 2 1.2 1.00 1 6 11 16 21 26 31 36 41 46 51 56 61 66 71 76 81 86 91 96 101 TSS Concentration (mg/L) F(TSS) Growth Model Overview Inputs Assumptions Outputs Model Validation • Model environmental variable output compared to data taken at the Rhode River over the past 26 years. • Error was found to be 18.2% for Salinity and 26.7% DO. DO Values 16 18 16 14 12 10 8 6 4 2 0 14 12 Model Data 10 8 Model 6 Data 4 2 0 1 2 3 4 5 6 7 8 Time (month) 36 DO (mg/L) Salinity (mg/L) Salinity Values 9 10 11 12 1 2 3 4 5 6 7 8 Time (month) 9 10 11 12 Growth Model Overview Assumptions Inputs Model Output Outputs P(3” Oyster within 3 years) = 0.79 1.00 1.00 0.90 0.92 0.80 0.79 0.70 P(Harvest) 0.60 0.57 0.50 0.40 0.30 0.20 0.27 0.10 0.00 1 2 3 Time to Market (yr) 37 4 5 2D Tidal Mixing Model [1] Overview Assumptions Inputs Outputs Oyster Biomass Tidal Flow Cell Attributes N,P,TSS Load Input Cell Placement Source: J. Askvig et al 2010 [1] 38 N,P,TSS Removed Output 2D Tidal Mixing Model Overview Assumptions Inputs Outputs • The water column being modeled is thoroughly mixed. (based on data taken by team at WRR, September/October 2011). • Filtration rates will be uniform for the entire cell. • Wind shear will be negligible. • Tide flow into each cell occurs instantaneously. • Environmental variable concentrations are assumed to be uniform throughout each cell. 39 2D Tidal Mixing Model Overview Assumptions Inputs Outputs Cell Attributes Cell Surface Area (m^2) Average Depth (m) Volume (m^3) 1 3,099,012 3.05 9,445,789 2 3,024,895 2.44 7,375,904 3 2,322,522 2.13 4,955,333 4 1,251,301 1.22 1,525,586 5 4,211,924 2.75 11,582,791 6 4,603,933 2.13 9,822,951 7 2,526,922 1.83 4,621,235 8 1,493,339 1.22 1,820,679 9 1,390,849 1.17 1,627,293 Total Volume 52,777,561 Source: J. Askvig et al. 2011 [1] 40 2D Tidal Mixing Model Overview Assumptions Inputs Outputs Tidal Flow Vn= Volume of Cell n Tn= Tide volume of Cell n Nn= Nitrogen concentration of Cell n F = River volume Bn = Bay Concentration of Nitrogen Rn = River Concentration of Nitrogen Cell 1 to Cell 2: N2= (N2·V2+ N1·T2) / (V2+T2) N1= (N1· (V1+ T1 ) + Bn·T1 - N1·T2) / (V1+T1) Cell 2 to Cell 3: N3= (N3·V3+ N2·T3) / (V3+T3) V1 Ve N2= (N2· (V2+ T2 ) + N1·T3 - N2·T3) / (V2+T2) N1= (N1· (V1+ T1 ) + Bn·T3 - N1·T3) / (V1+T1) Cell 3 to Cell 4: N4= (N4·V4+ N3·T4) / (V4+T4) N3= (N3· (V3+ T3 ) + N3·T4 - N3·T4) / (V3+T3) N2= (N2· (V2+ T2 ) + N1·T3 - N2·T4) / (V2+T2) Source: VIMS, 1993 41 V0 V0+Ve+Vt1 = V2 Assume complete mixing and a new N2 mg/L 2D Tidal Mixing Model Overview Assumptions Inputs Model Output Outputs 1,000,000 Oysters 10,000,000 Oysters 12 10.36% 10 % TSS Removed 8 6 4 1.66% 2 0 0 0.5 1 1.5 2 2.5 Time (years) 42 3 3.5 4 4.5 5 Business Model Overview Assumptions Inputs Outputs Operation Costs Yearly Cash Flows Oyster Selling Price Time Demand for Oysters Growth of Oysters 43 Revenue - Cost Probability of Profit Business Model Overview Assumptions Inputs Outputs • Will receive MDNR loan for oysters and shell • Interest only for three years • 40% forgiven at beginning of fourth year • Last two years at 5% interest • Total capacity of aquaculture business will be split by five and planted in fifths annually to increase probability of profits each year • i.e.) If total capacity desired is one million oysters, each year 200,000 will planted • All of the oysters at market size at the beginning of a season will be harvested, sold, and replaced by new oysters in the water • Discount rate equals 2% 44 Business Model Overview Assumptions Inputs Outputs Costs per 200,000 Oysters/year (up to 1,000,000 cap) Remote Setting Nursery Spat-on-Shell Grow-out Labor (recurring yearly) $516 $3,600 $1600 Grow-out Equipment (capital) $23,110 $14,300 $0 Oysters and Shell (recurring yearly) $720 $1,920 $2,570 Cages and Setup (recurring yearly for 5 years) $23,313 $23,313 $23,313 Cleaning (Recurring yearly) $8,020 $8,020 $8,020 45 Business Model Overview Assumptions Inputs Average ROI in 5 Years 46 Outputs Business Model Overview Assumptions Inputs Outputs Sensitivity of ROI in 5 Years 5 Million Oysters – Remote Setting Half-Shell 47 Business Model Overview Assumptions Inputs Outputs Frequency of ROI Year 3 – 5 Million Oysters 48 Average ROI in 3 Years Remote Setting 2.1 Nursery 1.3 SOS 1.4 Business Model Overview Assumptions Inputs Outputs Frequency of ROI Year 5 – 5 Million Oysters 49 Average ROI in 5 Years Remote Setting Nursery SOS 4.9 3.0 3.3 Utility Function Overview Cost vs. Utility Value Hierarchy Aquaculture System Objective Function Maximize Public Approval 0.25 Maximize Sustainability 0.75 Return on Investment 0.6 Availability of Shell Weights determined in conjunction with W/R Riverkeeper and SERC (Askvig et al, 2010) 50 0.4 Utility Function Overview Cost vs. Utility Cost vs. Utility -Remote Setting Half Shell has the highest ROI over all capacities -If Public Approval decreases 2% or more Nursery has highest utility -If Availability of Shell increases 5% or more Nursery has highest utility -If Public Approval increases 40% or more Spat-on-Shell has the highest utility 51 Agenda • • • • • • • 52 Context/Stakeholder Analysis Problem/Need Statement Design Evaluation Design Alternatives Simulation and Modeling Recommendations Project Plan/Budget Recommendations • It is recommended an oyster aquaculture system be implemented in the West and Rhode Rivers • While any amount of oysters will help decrease the turbidity of the river, 10 million oysters is recommended to maximize the effects of filtration. • Due to the sensitivity of the weights on the utility function remote setting or nursery operations are recommended for obtaining oysters with the decision made by the watermen based on location, local public approval, and personal preference. • It is recommended oysters be cleaned and packaged to be sold in the half shell market. 53 Agenda • • • • • • • 54 Context/Stakeholder Analysis Problem/Need Statement Design Alternatives Simulation and Modeling Sensitivity Analysis Recommendations Project Plan/Budget Work Breakdown Structure (WBS) WRR Aquaculture System 1.0 Management 2.0 Research 4.0 Modeling 5.0 Analysis 6.0 Report 1.1Work Breakdown Structure 2.1 Concept of Operations 3.1 Requirements 4.1 Oyster Growth Model 5.1 Trade-off Analysis 6.1 Papers 1.1 Weekly Reports 2.2 Oyster 3.2 Value Hierarchy 4.2 Business Model 5.2 Growth Model Analysis 6.2 PowerPoint Presentations 1.2 Meeting Minutes 2.3 Legal 3.3 Business Proposal 4.3 2DTMM Model 5.3 Cost-Benefit Analysis 6.3 Posters 1.3 Budget 2.4 Environment 2.5 Business 2.6 Field Research 55 3.0 Design 5.4 Long-Term Plan Project Schedule September October November December January February March April Management Scope Requirements Design Alternatives Model Research Paper 1 Utility Weights Paper 2 Model V/V Final Model Building Analysis Final Proposal Abstract Poster Paper Competition Prep 56 May Earned Value Management 57 Questions? This project has developed methods to clean the WRR which we can pursue with state agencies and watermen to clean the waters as well as benefit the investors financially. – Feedback from Chris Trumbauer, WR Riverkeeper. 58 References [1] J. Askvig et al., West and Rhode River Turbidity Reduction Project: Preliminary Evaluation. George Mason University, VA, 2011. [2] I. Urbina, Nov 2008, http://www.nytimes.com/2008/11/29/us/29poultry.html?partner=rss&emc=rss. Accessed October 20, 2011. [3] MDDNR, Apr 2009, http://www.dnr.state.md.us/dnrnews/infocus/oysters.asp . Accessed September 15, 2011. [4] MDDNR, Apr 2009, http://www.dnr.state.md.us/fisheries/oysters/industry/funding.asp. Accessed September 15, 2011. [5]C. Cerco and M. Noel, Can Oyster Restoration Reverse Cultural Eutrophication in Chesapeake Bay?. US Army Engineer Research and Development Center. Vicksburg, Ms, 2007. [6] Dr. Donohue, verbal communication [7] West/Rhode Riverkeeper, 2010, http://www.westrhoderiverkeeper.org/index.php/about-us/riverkeeper-program.html. Accessed September 1, 2011. [8] MDNR Report, http://www.dnr.state.md.us/fisheries/oysters/mtgs/111907/JudyOysHarvestsandRepletionProgram.pdf. Accessed October 10, 2011 [9] R. Wieland, The Feasibility for Sustainable Provision of Hatchery Products for Oyster Aquaculture in the Chesapeake Bay. Main Street Economics, Trappe, Md, 2007. [10] Horn Point Oyster Hatchery, 2011, http://www.hpl.umces.edu/hatchery/ . Accessed September 10, 2011. [11] Environmental Cooperative Science Center, 2008, http://ecsc.famu.edu/summaryiss.html. Accessed September 17, 2011. [12] Coast Seafoods Company, 2011, http://www.coastseafoods.com/triploid_oysters.html. Accessed September 12, 2011. [13] R. Kallen et al., Small Scale Oyster Farming for Chesapeake Watermen. TerrAqua Environmental Science Policy, LLC. September 2001, http://www.terraqua.org/SI_oyster_biz_plan.pdf [14] L. Allen, Nov 2010, http://www.cecilwhig.com/business/article_097d6b04-f803-11df-ac69-001cc4c002e0.html. Accessed September 12, 2011. . 59 References [15] R. Wieland, The Feasibility for Sustainable Provision of Hatchery Products for Oyster Aquaculture in the Chesapeake Bay. Main Street Economics, Trappe, Md, 2007. http://www.mainstreeteconomics.com/docs/MSERCfin.pdf [16] J. Davidsburg, Aug 2011, http://www.dnr.state.md.us/fisheries/news/story.asp?story_id=181. Accessed September 12, 2011 [17] MDDNR Data Hub, 2011, http://www.chesapeakebay.net/data/index.htm [18] West/Rhode Riverkeeper, Oct 2009, http://www.westrhoderiverkeeper.org/images/stories/PDF/West_River_Tech_Memo.pdf. Accessed September 3, 2011. [19] C. Cerco and M.Noel, Evaluating Ecosystem Effects of Oyster Restoration in Chesapeake Bay. Sep 2005, http://www.dnr.state.md.us/irc/docs/00015769.pdf [20] G. Merino, Considerations for Longline Culture Systems Design: Scallops production. Universidad Catolica del Norte. Chile. 1997 [21] M. Parker et al., Economics of Remote Setting in Maryland: A Spreadsheet for Cost Analysis. Maryland Sea Grant Extension, Md, 2011. [22] Oyster Restoration Partnership, 2011, http://www.oysterrecovery.org/Content/ContentDisplay.aspx?ContentID=118. Accessed September 12, 2011. [22] K. Gedan, Smithsonian Environmental Research Center, Presentation, November 2011. [23] D. Webster. Oyster Aquaculture Production. University of Maryland, MD, 2007. [24] Maryland Sea Grant, http://www.mdsg.umd.edu/issues/chesapeake/oysters/garden/guide/seed/. Accessed November 29, 2011. [25] Don Webster, Email Communication, 2012 [26] J. Quigley, Chesapeake Bay Oyster Company, Email Communication, 2012 [26] M. Congrove, A Bio-Economic Feasibility Model for Remote Setting: Potential for Oyster Aquaculture in Virginia. College of William and Mary. Virginia, 2009. [27] D. Fredriksson et al. Biological and Hydrodynamic Design Considerations For Vertically Oriented Oyster Grow Out Structures. United States Naval Academy, MD, 2010. 60 Appendix I - Our Field Data Station Depth (feet) w6 w20 AVG Specific Conductance(uS) Temp (C) Dissolved Oxygen % DO mg/L salinity (ppt) 2 23.5 5.78 3.13 91 7.6 8.2 4 23.6 5.8 3.14 90.7 7.62 8.25 6 23.7 5.85 3.17 90.3 7.51 8.32 8 23.7 5.85 3.17 92.1 7.63 8.34 10 23.3 5.84 3.17 91.1 7.63 8.35 12 23.1 5.78 3.13 93.6 7.9 8.37 2 22.9 5.88 3.19 91.4 7.65 8.2 4 23 5.89 3.2 91.4 7.67 8.16 6 23 5.91 3.12 87.6 7.23 8.14 8 23 5.92 3.22 86.1 7.23 8.11 10 23 5.91 3.22 86.6 7.13 8.07 12 22.9 5.95 3.23 82.9 6.99 8.03 23.23 5.86 3.17 89.57 7.48 8.21 Taken September 16, 2011 61 pH Appendix I - Our Field Data West/Rhode River Sample 10/14/11 Station W06 W20 CYC 62 Temp (°C) Depth (ft) Salinity (ppt) DO (%) DO (mg/L) pH SC (μS) 2 19.7 4.02 99 8.83 8.3 N/A 4 19.71 4.02 97.1 8.67 8.28 N/A 6 19.71 4.05 96.4 8.61 8.27 N/A 8 19.71 4.04 96 8.56 8.26 N/A 10 19.7 4.34 95 8.38 8.16 N/A 12 N/A N/A N/A N/A N/A N/A 2 19.75 3.85 99.1 8.82 8.39 N/A 4 19.74 3.86 97.4 8.7 8.35 N/A 6 19.74 3.85 97.1 8.68 8.34 N/A 8 19.74 3.85 97.1 8.67 8.33 N/A 10 19.74 3.86 97.1 8.68 8.32 N/A 12 N/A N/A N/A N/A N/A N/A 1 20.03 4.17 90.3 8.05 8.66 N/A 6 19.88 4.23 90.2 7.94 8.63 N/A Average 19.76 4.01 95.98 8.55 8.36 N/A Std 0.10 0.17 2.90 0.28 0.15 N/A Appendix II - Charts y = -4E-05x + 2.0926 R² = 0.0803 Rhode River Secci Depth (1984 - 2011) 2.5 Secci Depth Threshold 2 Secci Depth (m) Linear (Secci Depth) 1.5 1 0.5 0 October 1984 July 1987 April 1990 January 1993 October 1995 July 1998 Date (month/year) 63 March 2001 December 2003September 2006 June 2009 Appendix II - Charts 2010 VIMS Model – Secchi Depth Improvement 64 Appendix III - Definitions Turbidity Having sediment and/or foreign particles stirred up or suspended in water (haziness) Contributions to turbidity in WRR Excess nutrients and sediments that flow into the rivers through the tide Run off from surrounding land (Local residents, farms, construction) Suspended Solids (ie: algae) Reduce dissolved oxygen level, killing off other life in river. 65 Appendix III - Definitions Salinity Salt content of the water (measured in parts per thousand (ppt)) Salt water flows into the Chesapeake from the Atlantic Ocean. Fresh water flows into the Chesapeake from the Susquehanna River, creeks and rain. Eastern Oysters (Crassostrea virginica) require at least 7.5 ppt to be filtering effectively [2] 66 Appendix IV – Etc. Cage Equations • Floatation = Dry body weight * [1 – (δfluid/δbody)] • Resistance force = ½ * Cd * A * δ * v2 • Rope Sizing – Length: n = j * h – Tension: Tm-a = (Th2 + Tv2)0.5 – Rope Diameter: d = (Tmax * Fs)0.5 / Cr • Buoy Sizing – Vb = [W / [(δsw – δb) * g]] * Fs • Anchor System Sizing – Vanchor = Wdry / δanchor * g – Wsub = (Tm-a * cos Φ / μ) + Tm-a * sin Φ 67 Appendix IV – Etc. Cage Assemblies Longline Culture System • Mooring-Anchor System – Stabilizes the system against the effects of both vertical and horizontal stresses • Floatation System – Maintains suspension of the culture system • Growing System – Used to contain and grow oysters • Design Principles – Buoyancy Force • Floatation or Gravity Force on an Immersed Body – Resistance Force – Tension between all lines 68 nsgd.gso.uri.edu/hawau/hawauw97002/hawauw97002_part6.pdf Appendix V: Oyster Lifecycle Larvae Data Source = Maryland Sea Grant, 2011 69 Seed Spat-on-Shell Appendix VI: Potential Risks 70 Risks Mitigation Plan Theft(poaching) Build relations with adjacent watershed residents to have community monitoring Catastrophic weather (effecting equipment) Reduce profit (rainy day fund) Catastrophic weather (effecting oyster growth) Reduce profit (rainy day fund), replace oyster biomass Disease Monthly cleaning for preventive care, harvest before 7 years Change in market demand Sensitivity shows we will still have positive ROI with 30% demand decrease Lack of available shell Accounted for in utility, may reduce profit. Low public approval Community outreach program early in permitting process Injury to workers Covered in liability insurance Appendix VII: Average NPV in 5 Years 71 Appendix VIII – Remote Setting Inventory Costs 72 Appendix IX – Remote Setting Operations Costs 73 Appendix X – Nursery Inventory & Operations Costs 74 Appendix XI – Spat-on-Shell Inventory & Operations Costs 75 Appendix XII – Cage System Inventory & Operations Costs 76 Appendix XIII – All System Costs 77
