BEACON CODE USAGE STATISTICS Abstract
advertisement
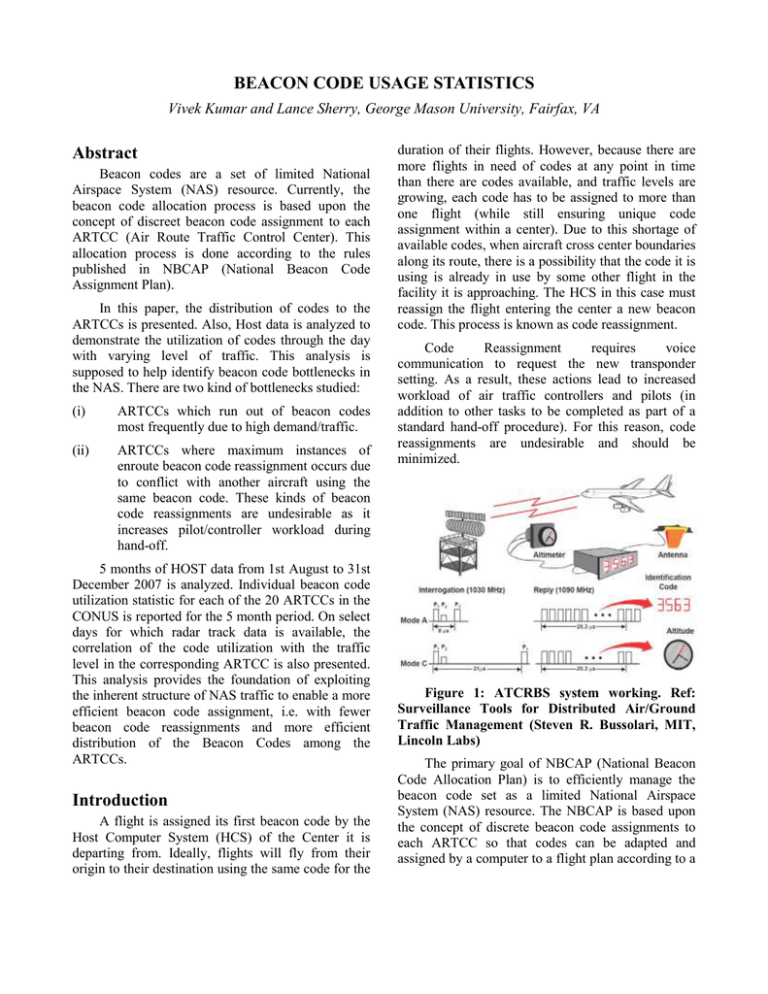
BEACON CODE USAGE STATISTICS Vivek Kumar and Lance Sherry, George Mason University, Fairfax, VA Abstract Beacon codes are a set of limited National Airspace System (NAS) resource. Currently, the beacon code allocation process is based upon the concept of discreet beacon code assignment to each ARTCC (Air Route Traffic Control Center). This allocation process is done according to the rules published in NBCAP (National Beacon Code Assignment Plan). In this paper, the distribution of codes to the ARTCCs is presented. Also, Host data is analyzed to demonstrate the utilization of codes through the day with varying level of traffic. This analysis is supposed to help identify beacon code bottlenecks in the NAS. There are two kind of bottlenecks studied: (i) ARTCCs which run out of beacon codes most frequently due to high demand/traffic. (ii) ARTCCs where maximum instances of enroute beacon code reassignment occurs due to conflict with another aircraft using the same beacon code. These kinds of beacon code reassignments are undesirable as it increases pilot/controller workload during hand-off. 5 months of HOST data from 1st August to 31st December 2007 is analyzed. Individual beacon code utilization statistic for each of the 20 ARTCCs in the CONUS is reported for the 5 month period. On select days for which radar track data is available, the correlation of the code utilization with the traffic level in the corresponding ARTCC is also presented. This analysis provides the foundation of exploiting the inherent structure of NAS traffic to enable a more efficient beacon code assignment, i.e. with fewer beacon code reassignments and more efficient distribution of the Beacon Codes among the ARTCCs. Introduction A flight is assigned its first beacon code by the Host Computer System (HCS) of the Center it is departing from. Ideally, flights will fly from their origin to their destination using the same code for the duration of their flights. However, because there are more flights in need of codes at any point in time than there are codes available, and traffic levels are growing, each code has to be assigned to more than one flight (while still ensuring unique code assignment within a center). Due to this shortage of available codes, when aircraft cross center boundaries along its route, there is a possibility that the code it is using is already in use by some other flight in the facility it is approaching. The HCS in this case must reassign the flight entering the center a new beacon code. This process is known as code reassignment. Code Reassignment requires voice communication to request the new transponder setting. As a result, these actions lead to increased workload of air traffic controllers and pilots (in addition to other tasks to be completed as part of a standard hand-off procedure). For this reason, code reassignments are undesirable and should be minimized. Figure 1: ATCRBS system working. Ref: Surveillance Tools for Distributed Air/Ground Traffic Management (Steven R. Bussolari, MIT, Lincoln Labs) The primary goal of NBCAP (National Beacon Code Allocation Plan) is to efficiently manage the beacon code set as a limited National Airspace System (NAS) resource. The NBCAP is based upon the concept of discrete beacon code assignments to each ARTCC so that codes can be adapted and assigned by a computer to a flight plan according to a specific procedure. Ideally, each ARTCC should be allocated enough exclusive code blocks so that each aircraft could be given a computer assigned unique discrete code which would not be duplicated anywhere in the NAS. The intent would thereby, allow all aircraft to proceed from departure to destination using the same discrete code. Unfortunately, duplicate computer code assignments are unavoidable because of the limited number of code subsets available, the number of ARTCC's, and the volume of traffic. To minimize the impact of duplicate computer assignments, careful analysis of code utilization statistics is required to ensure appropriate facility assignments. Therefore, ARTCC facility assignments are managed from the national level. The objective of this research is to analyze historical Host data to identify ARTCCs with Beacon Code shortage and reassignment problems. This paper is organized as follows: In the following section, the functioning of ATCRBS is described. Next, relevant previous work is discussed followed with the data sources and analysis. Finally, the implications of these results are discussed in the conclusion section. When an aircraft receives a mode 3/A interrogation, the reply expected is a Beacon/Squawk code. Current mode 3/A transponders installed on aircraft are designed to transmit four octal digits, resulting in a total of 84 = 4096 possible beacon codes. Many of the codes are reserved for special uses such as military operations, which further reduces the number of codes available for use by civilian aviation. The National Beacon Code Allocation Plan (NBCAP) established by DoT/FAA order 7110.66D [4] permanently allocates the remaining beacon codes to the ARTCC‟s. The controller uses the beacon code as the unique identifier for flights within a center boundary. In order for the controller to uniquely identify and address each aircraft it is necessary to ensure that all aircraft flying within the area of responsibility of that controller are uniquely identifiable, i.e. each aircraft within that center has a unique beacon code. Previous Work Geographic Beacon Code Allocation study by Lucic et al [5] includes statistic on Beacon Codes reassignments. There is no previous work on the statistic of code utilization. How ATCRBS Works ATCRBS is an acronym for Air Traffic Control Radar Beacon System. It is a system used in ATC to enhance surveillance radar monitoring and separation of aircraft [1][2][3]. ATCRBS consists of transponders (in aircraft) and Secondary Surveillance Radar (SSR) which is colocated with the Primary Surveillance Radar (PSR) on the ground. The SSR located at the ATC site, transmits interrogations and listens for replies. Transponders located on the aircraft receive interrogations, decode it and respond with requested information (mode 1,2,3/A,C). As shown in Figure 1, ATCRBS interrogator at the ATC facility on ground periodically interrogates aircraft on a frequency of 1030 MHz. Aircraft receiving this interrogation reply with the requested information (altitude and/or identification) after a 3 micro second delay. The interrogator then decodes the reply and identifies the aircraft. Figure 2: Number of Beacon Code Reassignments in NAS Figure 2 shows the number of beacon code reassignment instances in the entire NAS for 17 days. These numbers are very similar to the ones obtained by the analysis of 153 days of HOST data even though the data used in this study is for 2007. This shows that there has been close to no change in the frequency of beacon code reassignment in the NAS in the last decade. Data Sources The data used in this study was obtained from HOST data which is recorded for every ARTCC in the NAS. The data extracted spans over a period of 183 days from 1st August, 2007 to 31st December 2007. There are two types of data: A. Utilization Beacon(UB) Message Each ARTCC has one entry (row) for every hour of the day. A snapshot of the data is shown in Figure 3. The following fields are used: Figure 3: Snapshot of Utilization Beacon(UB) Host Data The following fields are used: i. Center ID: 3 letter ARTCC code. Eg: ZAB – Albuquerque Center. Center ID: 3 letter ARTCC code. Eg: ZAB – Albuquerque Center. ii. Date iii. Block ii. Date iv. iii. Block iv. Time(hhmmssxxxx): The first 6 letters are time in the hhmmss format. Time (hhmmssxxxx): The first 6 letters are time in the hhmmss format. The remaining 4 letters are irrelevant for the purpose of this analysis. v. Time converted to seconds starting at midnight on 1st August 2007. v. Call sign of Flight 1: The flight identifier of flight which is already using the corresponding Beacon Code. vi. Peak Number of Internal Primary and Secondary Codes and the total number of adapted codes. vi. vii. Peak Number of Internal Tertiary Codes and the total number of adapted codes. Call sign of Flight 2: The flight identifier of flight whose beacon code needs to be reassigned due to potential conflict with beacon code of flight 1. vii. Computer Identifier of Flight 1. Peak Number of External Primary and Secondary Codes and the total number of adapted codes. viii. Computer Identifier of Flight 2. ix. Beacon Code of Flight 1(In use). Peak Number of External Tertiary Codes and the total number of adapted codes. x. Beacon Code of Flight 2(Reassigned). xi. Origin of Flight 1. xii. Origin of Flight 2. xiii. Destination of Flight 1. xiv. Destination of Flight 2. i. viii. ix. x. Number of midnight. Code Reassignments since B. Beacon Reassignment(BA) Message A snapshot of the data is shown in Figure 4. Each row corresponds to an instance of Beacon Code Reassignment. The 5 days of 2007 for which ETMS data was used are: 3rd January (Winter), 11th April (Spring), 26th July (Summer), 21st November(Thanksgiving) and 19th December(Winter). A snapshot of the data is shown in Figure 5. The data has 48966 tracks (each track is one flight leg). It also includes international and cargo flights. Military flights are not included in this data as they have their own reserved set of beacon codes. The following fields were used: Figure 4: Snapshot of Beacon Reassignment (BA) Host Data i. FID – this field is the unique identifier for a flight leg. ii. Time – Time in seconds from 12 AM GMT on the corresponding date. iii. ACID – Airline assigned aircraft ID. Eg: AAL900 iv. AcType – Aircraft Type. Eg: B752 v. Ori – 3 or 4 letter ICAO code for origin airport. Eg: ORD vi. Dest – 3 or 4 letter ICAO code for destination airport. vii. Lat – Latitude of the aircraft at the corresponding time in minutes. Eg: 2906 represents 2906/60 ~ 48.43 degree North viii. Lon – Longitude of the aircraft at the corresponding time in minutes. Eg:3674 represents 3674/60 ~ 61.23 degrees West. C. DoT/FAA Order JO 7110D The current allocation of Beacon Codes to each ARTCC is published in FAA Order JO 7110D. D. ETMS 4-D Trajectory Data ETMS (Enhanced Traffic Management System) data for 5 days of 2007 spanning different seasons was used in this analysis to validate the BC reassignment and utilization statistic from the Host data using a NBCAS(National Beacon Code Assignment Simulator – to be discussed in Section III). ix. Alt – Represents the flight altitude level. Analysis and Results A. Beacon Code Allotment for each ARTCC Figure 5: Snapshot of enroute ETMS data Figure 6 shows the distribution of Beacon Codes to all the 20 ARTCCs in the CONUS according to DoT/FAA Order JO 7110D. The blue and magenta bars are for external and internal codes respectively. Both charts in Figure 6 show the same information (number of codes); the top chart is sorted by number of external codes and the bottom one is sorted by internal codes. ZMA (Miami Center) is the center with the highest number of external beacon codes allocated to it (1118 codes). ZHU (Houston Center) has the highest number of internal beacon codes (567 codes). external and internal category for ZTL for the 153 days of Host Data analyzed is 0.116 and 0.225 respectively. Figure 8 shows a histogram with maximum code(External) utilization fraction during each day on x-axis and number of days (out of population of 153) on y-axis. The mean and median of this histogram is 0.0089 and 0.088 respectively. Figure 6: Distribution of Beacon Codes by ARTCC B. Beacon Code Utilization from HOST Data Host UB(Utilization Beacon) data has information on the number of codes in each category(external, internal, primary, secondary, tertiary) that are being used for each hour of the day. Figure 8: Histogram of Max Code Utilization Fraction for ZTL (External Codes) Figure 9 shows a similar histogram as Figure 8 but for the Internal Code category. The mean and median in this case is 0.153 and 0.156 respectively. Figure 7: ZTL Code Utilization for External (Top figure) and Internal (Bottom figure) Primary and Secondary Codes for 153 days of 2007 Figure 7 shows the fraction of codes being utilized by the ZTL ARTCC for all the 153 days as a function of time. The top and bottom figure shows the utilization in External and Internal categories respectively. The maximum code utilization in the Figure 9: Histogram of Max Code Utilization for ZTL (Internal Codes) The plots and histograms shown in Figure 7, Figure 8 and Figure 9 were done for all the 20 ARTCCs. A summary of the mean and median of maximum code utilization fraction per day for each of the 20 ARTCCs is shown in Table 1 and Figure 10 shows that ZHU had the highest code utilization in the internal category of 0.529. ZLC had the highest code utilization in the External category of 0.389. C. Beacon Code Reassignment from HOST Data Every row of the Host BA (Beacon Code Reassignment) data corresponds to an instance of Beacon Code Reassignment in the NAS. Figure 11 shows the number of Beacon Code Reassignments in NAS for each of the 153 days in HOST data analyzed. The mean number of reassignments is 7642 and the median is 7768. It can be observed in Figure 12 that the number of BC reassignments on a given day is mostly in the 8000-9000 range. It was also derived from the ETMS data processing (to be discussed in following section) that there are on an average approximately 73000 hand-offs (ARTCC boundary crossing instances) per day in NAS. As a result, the probability of a pilot having to change his code when crossing an ARTCC boundary is about 910% ([8000 to 9000]/[70000-75000]). Table 2 for External and Internal Beacon codes respectively. In both the tables the last column shows whether or not the Kolmogorov-Smirnov test rejects the null hypothesis that the Max Utilization Fraction is normally distributed with p-value of 0.05. Figure 10: Maximum Code Utilization for each of the 20 ARTCCs (for 153 days of Host Data) Table 1: Max Utilization Fraction for External Primary and Secondary Codes for 153 days of 2007 (Host Data) ARTCC Max of Medi Mean Normally Distributed ZAB ZAU ZBW ZDC ZDV ZFW ZHU ZID ZJX ZKC ZLA ZLC ZMA ZME ZMP ZNY ZOA ZOB ZSE ZTL Max an 0.321 0.198 0.265 0.176 0.317 0.265 0.227 0.227 0.176 0.317 0.265 0.389 0.122 0.267 0.204 0.115 0.222 0.11 0.317 0.116 0.289 0.154 0.195 0.162 0.263 0.221 0.197 0.198 0.133 0.282 0.264 0.295 0.09 0.233 0.167 0.106 0.184 0.086 0.253 0.088 (Kolmogorov -Smirnov Test with p = 0.05) 0.289 0.157 0.19 0.164 0.26 0.222 0.197 0.2 0.131 0.283 0.265 0.286 0.087 0.241 0.164 0.107 0.183 0.087 0.25 0.088 Yes Yes Yes No Yes Yes Yes Yes Yes Yes No No No No Yes No Yes No Yes Yes Figure 10 shows that ZHU had the highest code utilization in the internal category of 0.529. ZLC had the highest code utilization in the External category of 0.389. D. Beacon Code Reassignment from HOST Data Every row of the Host BA (Beacon Code Reassignment) data corresponds to an instance of Beacon Code Reassignment in the NAS. Figure 11 shows the number of Beacon Code Reassignments in NAS for each of the 153 days in HOST data analyzed. The mean number of reassignments is 7642 and the median is 7768. It can be observed in Figure 12 that the number of BC reassignments on a given day is mostly in the 8000-9000 range. It was also derived from the ETMS data processing (to be discussed in following section) that there are on an average approximately 73000 hand-offs (ARTCC boundary crossing instances) per day in NAS. As a result, the probability of a pilot having to change his code when crossing an ARTCC boundary is about 910% ([8000 to 9000]/[70000-75000]). Table 2: Max Utilization Fraction for Internal Primary and Secondary Codes for 153 days of 2007 (Host Data) ARTCC Max of Max Median Mean Normally Distributed (KolmogorovSmirnov Test with p = 0.05) ZAB ZAU ZBW ZDC ZDV ZFW ZHU ZID ZJX ZKC ZLA ZLC ZMA ZME ZMP ZNY ZOA ZOB ZSE ZTL 0.317 0.127 0.21 0.292 0.163 0.234 0.529 0.217 0.365 0.37 0.397 0.19 0.193 0.206 0.286 0.466 0.137 0.233 0.313 0.225 0.219 0.089 0.113 0.218 0.117 0.168 0.499 0.134 0.258 0.262 0.314 0.143 0.116 0.145 0.225 0.261 0.099 0.179 0.237 0.153 0.233 0.089 0.105 0.219 0.119 0.171 0.529 0.132 0.27 0.286 0.313 0.151 0.111 0.159 0.238 0.243 0.102 0.18 0.246 0.156 No Yes No Yes No Yes No Yes No No Yes No No No No No Yes Yes No Yes Figure 11: Number of Beacon Code Reassignments in the NAS for each of the 153 days in HOST data Figure 12: Histogram of BC Reassignments for 153 days of HOST Data E. Beacon Code Reassignment Statistic from ETMS Data Figure 13 shows the number of Hand-Offs and beacon code reassignment instances from the ETMS data for 5 days. The number of Hand-Offs ranges from approximately 70000 to 75000. The probability of beacon code reassignments (shown as red squares) ranges from 9-10%. Figure 13: Beacon Code Hand-Off Reassignments from ETMS Data and F. Beacon Code Utilization and Reassignment using the NBCAS (National Beacon Code Assignment Simulator) NBCAS is a simulator designed to mimic current day NAS beacon code allocation process. There are certain limitations on exactly reproducing the day-to-day operations due to the current unavailability of data such as flight cancellation ground delay and flight cancelation. As shown in Figure 14, NBCAS has two major inputs, track data and beacon code allocation rules. The source of track information is historical ETMS TZ hits and beacon code allocated rules are obtained from FAA NBCAP Order JO 7110.66D. Figure 14: NBCAS (National Beacon Code Assignment Simulator) Block-Diagram (i) Preprocessor: ETMS has 4-D flight trajectories. In order to be able to convert a given flight track into a sequential list of ARTCCs traversed, the boundary crossing points (time and location) is extracted from the TZ hits. This can be done using point in a polygon method. Once the boundary crossing time in known, the result is exported into a separate data structure where each track is stored as a sequential list of ARTCCs traversed along with the entry and exit time for each center along its path. (ii) B Code Allocator: The NBCAS assigns codes to aircraft according to the rules described in DoT/FAA Order JO 7110D. Input to this process is preprocessed data which is 4-D track data converted to ARTCC-by-ARTCC path data with entry and exit time for each ARTCC on the path of individual aircraft. The time-increment for the current NBCAS plan is 5 minutes, i.e. code allocation is done for every 5 minute interval. For every flight active in the NAS (active = requiring beacon code) during the current time period, it is first checked whether the current ARTCC for that flight is the same as the ARTCC that flight was in during the previous time step, in other words, whether or not the flight has crossed an ARTCC boundary or if it has just become active. In either case it needs to be assigned a code. If the flight is crossing into another ARTCC then the code that the flight is already assigned is checked for conflict against the flights already active in the following ARTCC. If there is no „code conflict‟ the flight just keeps its old code. Otherwise, a new code is to be assigned to this flight from the code bucket of the entering ARTCC. The code assignment is done in the order primary, secondary and tertiary. The primary and secondary list is searched in cyclic order and the tertiary codes, if needed, are searched in top-down order. It must be noted here that flights which are active in the current time step but would disappear (land and no longer need a code) in the next time step are recorded in an array which is checked after each time period to release the codes corresponding to such flights at the end of current time step. (iii) Post-processor: After the B-Code Allocator module allocates code to individual flights according to rules of NBCAP, the post-processor module calculates statistic on the allocated codes. The statistics are produced in the same format as reported in HOST data to enable easy comparison and also facilitate the validation of the NBCAS implementation. Figure 15 shows for ZDC, a comparison of code assignment through NBCAS for July 26th through NBCAS(two plots on Left hand side) and the actual code assignment recorded in the HOST data(plots on RHS) for both external(top) and internal(bottom) category. It can be observed that for both the external and internal codes, the utilization plot (red line) follow the same trend and values through the day for both NBCAS output and the Host UB data. This means that code assignment through NBCAS is fairly accurate for both internal and external code categories. it can be concluded that the probability of a pilot having to change his code when crossing an ARTCC boundary is about 9-10% ( [8000 to 9000]/[7000075000]). The NBCAS developed from the implementation of rules in DoT/FAA Beacon Code Order JO7110D is validated by successfully comparing its output with the Host Data for the corresponding days. Using this simulator, different Beacon Code assignment strategies can be tested out and compared with the baseline for current and futuristic traffic levels. Figure 15: Comparison of NBCAS Output and Host Data for ZDC July 26, 2007 Conclusions Of the 153 days of Host data of latter half of 2007 analyzed, ZHU ARTCC has the maximum code utilization in the internal category of 0.529. In the external category of codes, ZLC has the highest code utilization in the External category of 0.389. The mean number of Beacon Code Reassignments in NAS for 153 days in HOST data analyzed is 7642 and the median is 7768. The number of BC reassignments on a given day is in the 8000-9000 range. From the ETMS Hand-Offs data the number of hand-offs in a day is observed to be approximately 73000. Using this as the denominator References [1] R. Neufville and A. Odoni, Airport Systems Planning, Design, and Management, 2002. [2] M. Nolan, “Fundamentals of Air Traffic Control,” 2007. [3] S. Bussolari, “Surveillance Tools for Distributed Air/Ground Traffic Management.” [4] “DOT/FAA Order 7110.66D, National Beacon Code Allocation Plan NBCAP, Federal Aviation Administration.” [5] Lucic, Geographic Beacon Code Allocation Optimization, CSSI Inc., 2005.

