STATISTICS 402B Spring 2016 Homework Set#6 Solution 1. .
advertisement
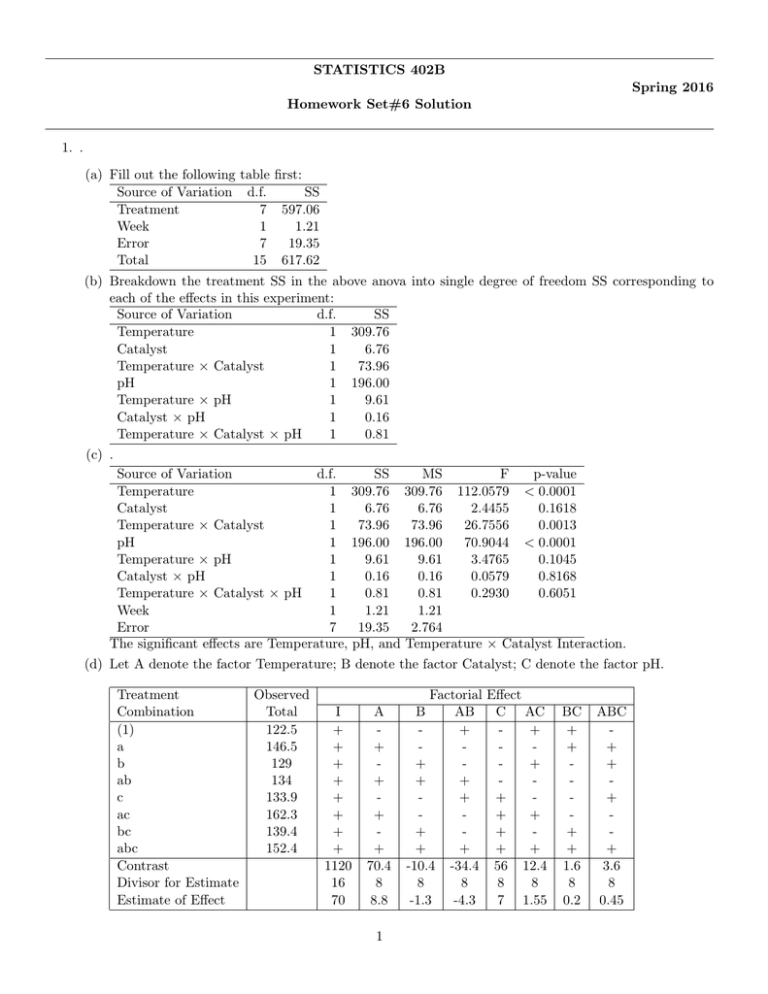
STATISTICS 402B Spring 2016 Homework Set#6 Solution 1. . (a) Fill out the following table first: Source of Variation d.f. SS Treatment 7 597.06 Week 1 1.21 Error 7 19.35 Total 15 617.62 (b) Breakdown the treatment SS in the above anova into single degree of freedom SS corresponding to each of the effects in this experiment: Source of Variation d.f. SS Temperature 1 309.76 Catalyst 1 6.76 Temperature × Catalyst 1 73.96 pH 1 196.00 Temperature × pH 1 9.61 Catalyst × pH 1 0.16 Temperature × Catalyst × pH 1 0.81 (c) . Source of Variation d.f. SS MS F p-value Temperature 1 309.76 309.76 112.0579 < 0.0001 Catalyst 1 6.76 6.76 2.4455 0.1618 Temperature × Catalyst 1 73.96 73.96 26.7556 0.0013 pH 1 196.00 196.00 70.9044 < 0.0001 Temperature × pH 1 9.61 9.61 3.4765 0.1045 Catalyst × pH 1 0.16 0.16 0.0579 0.8168 Temperature × Catalyst × pH 1 0.81 0.81 0.2930 0.6051 Week 1 1.21 1.21 Error 7 19.35 2.764 The significant effects are Temperature, pH, and Temperature × Catalyst Interaction. (d) Let A denote the factor Temperature; B denote the factor Catalyst; C denote the factor pH. Treatment Combination (1) a b ab c ac bc abc Contrast Divisor for Estimate Estimate of Effect Observed Total 122.5 146.5 129 134 133.9 162.3 139.4 152.4 I + + + + + + + + 1120 16 70 A + + + + 70.4 8 8.8 1 Factorial B AB + + + + + + + + -10.4 -34.4 8 8 -1.3 -4.3 Effect C AC + + + + + + + + 56 12.4 8 8 7 1.55 BC + + + + 1.6 8 0.2 ABC + + + + 3.6 8 0.45 (e) 2 × sE = s.e.(E) = 2 × 2k √ 2.764 = 0.83, t0.975,8 = 2.31, t0.975,8 s.e.(E) = 1.92 2 The approximate 95% CI’s are: Effects A B C AB AC BC ABC 95% C.I. 8.8±1.92 -1.3±1.92 -4.3±1.92 7±1.92 1.55±1.92 0.2±1.92 0.45±1.92 (f) Effect A: Effect A is positive and increase the mean by 8.8 Effect C: Effect C is positive and increase the mean by 7 B A 130 150 1 64.10 77.20 2 67.10 71.60 At the low level of A, effect of B is to increase mean by 3. At the low level of B, effect of A is to increase mean by 13.1. 2 2. . (a) . Effect A B A*B C A*C B*C A*B*C D A*D B*D A*B*D C*D A*C*D B*C*D A*B*C*D DF Sum of Squares 1 0.00002500 1 0.11902500 1 0.00010000 1 0.03802500 1 0.00040000 1 0.02250000 1 0.00122500 1 0.18922500 1 0.00040000 1 0.00040000 1 0.00022500 1 0.00010000 1 0.00002500 1 0.00002500 1 0.00040000 (b) . 0.25 D 0.2 0.15 0.1 C 0.05 0 -0.05 B*C -0.1 -0.15 B -0.2 -2 -1.5 -1 -0.5 0 z-score (c) Important Effects: Effect B C BC D Estimate -.1725 0.0750 -0.0750 0.2175 SS 0.119025 0.038025 0.022500 0.189225 (d) . 3 0.5 1 1.5 2 B*C Least Squares Means Table Level Least Sq Mean 0.49750000 0.67000000 0.40000000 0.42250000 -1,-1 -1,1 1,-1 1,1 Std Error . . . . LS Means Plot 0.8 -1 0.7 1 0.6 0.5 0.4 0.3 0.2 -1 1 C D it is observed that impurity is higher (.67) at the low level of B and From the BC interaction plot, Least Squares Means Table high level of C. However, since the investigator is interested in keeping the mean impurity small, it is Level Least Sq Std Error Mean observed that they are smaller at the Mean high level of B (and smallest at the low level of C). -1 0.38875000 . 0.388750 (e) It is observed clearly that Main Effect A and all involving factor A are very small and therefore can 1 0.60625000 . 0.606250 be considered negligible. Thus we ignore factor A and analyze the data as a 23 facorial with two LS Means Plot 0.8 replications of all treatment combinations of B, C and D. This is easily accomplished by using the same JMP data table as in part 0.7(a) and doing a full factorial of the factors B, C, and D. The following 0.6 ANOVA table is the result: 0.5 Source DF Treatment B C B*C D B*D C*D B*C*D Error Total 7 1 1 1 1 1 1 1 8 15 0.4 Sum of 0.3 Squares 0.2 0.369300 0.119025 0.038025 0.022500 0.189225 0.000400 0.000100 0.000025 0.002800 0.372100 -1 Mean Square 0.052757 D 0.119025 0.038025 0.022500 0.189225 0.000400 0.000100 0.000025 0.000350 1 F Ratio p-value 150.7347 340.0714 108.6429 64.2857 540.6429 1.1429 0.2857 0.0714 < .0001∗ < .0001∗ < .0001∗ < .0001∗ 0.3162 0.6075 0.7960 Clearly, effects B,C, D and BC are the only significat effects. (f) The recommendation is that the level of factor B (concentration of NaOH) be increased to 45% to reduce the mean impurity level, while keeping the other facors at the current levels. 4

