Document 10714882
advertisement
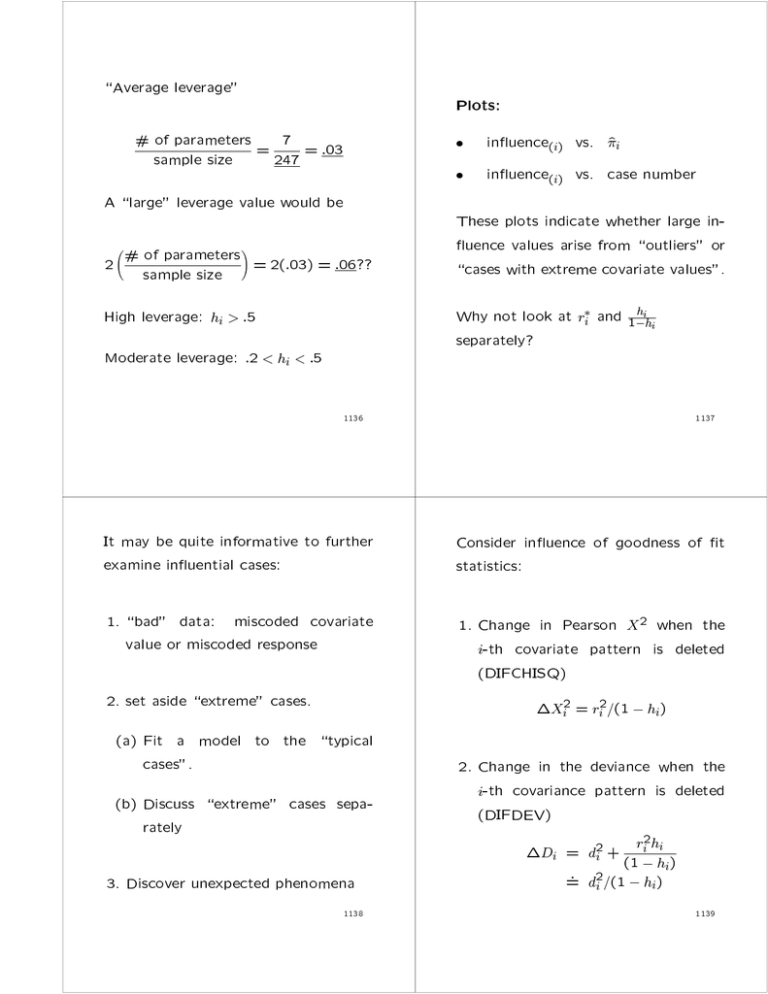
\Average leverage" Plots: # of parameters = 7 = :03 sample size 247 A \large" leverage value would be of parameters! = 2(:03) = :06?? 2 # sample size High leverage: hi > :5 Moderate leverage: :2 < hi < :5 inuence i vs. ^i inuence i vs. case number () () These plots indicate whether large inuence values arise from \outliers" or \cases with extreme covariate values". Why not look at ri and separately? 1 hi hi 1136 1137 It may be quite informative to further examine inuential cases: Consider inuence of goodness of t statistics: 1. \bad" data: miscoded covariate value or miscoded response 1. Change in Pearson X when the i-th covariate pattern is deleted (DIFCHISQ) Xi = ri =(1 hi) 2. set aside \extreme" cases. (a) Fit a model to the \typical cases". (b) Discuss \extreme" cases separately 3. Discover unexpected phenomena 1138 2 2 2 2. Change in the deviance when the i-th covariance pattern is deleted (DIFDEV) Di = di + (1ri hhi i) =: di =(1 hi) 2 2 2 1139 C bari = Xi 2 0 2@ PROC LOGISTIC provides measures of inuence for individual parameters. 1 hi A hi 1 = (C bari)(h1i ) ri 1. Delete the i-th covariance pattern 2. Compute ^j;all data An \extreme" set of covariate values may have a strong \inuence" on only one, or two, or a few values for parameter estimates. all data j; This requires too much computation. 1141 1140 Use an approximation = (X 0V^ X ) xi(Yi 2 ^ 3 66 i 77 = 64 ^. 75 k i ^ 1 (i) ^ ) (1 ni i = 0( ) () Then, for the j-th coeÆcient, DFBETAj; i = S^j; i () () ^j 1142 ^j;i th cov. pattern deleted S^ hi )
