Cooperative Extension 1993 Cotton Management Economic Notes
advertisement
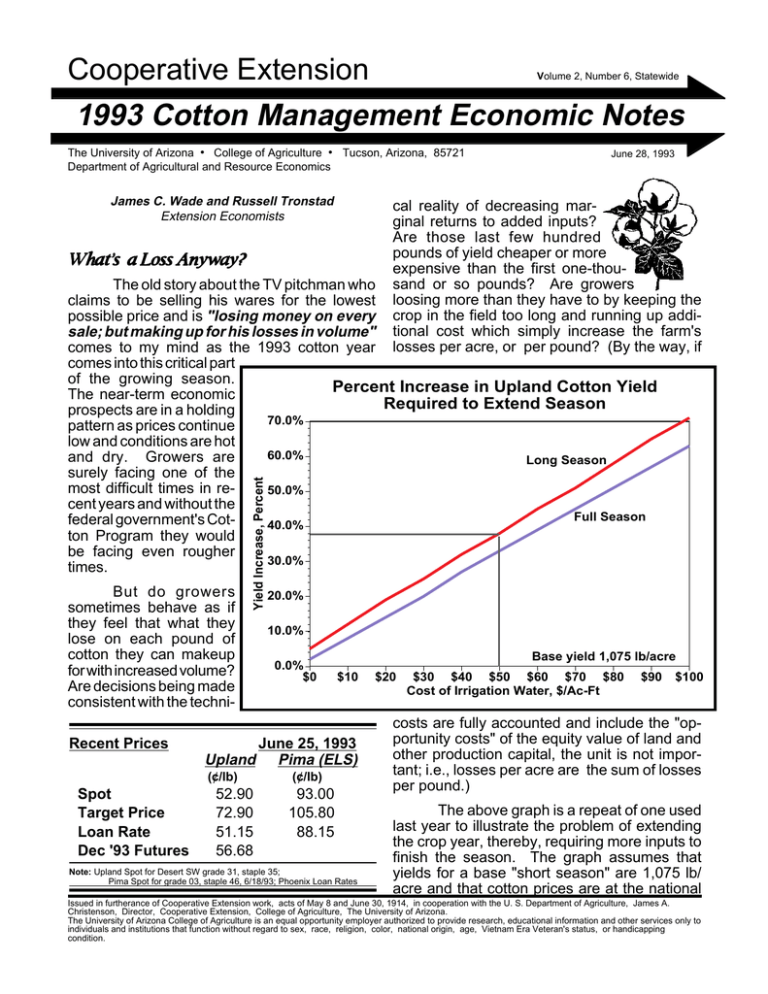
Cooperative Extension Volume 2, Number 6, Statewide 1993 Cotton Management Economic Notes The University of Arizona • College of Agriculture • Tucson, Arizona, 85721 Department of Agricultural and Resource Economics James C. Wade and Russell Tronstad Extension Economists June 28, 1993 cal reality of decreasing marginal returns to added inputs? Are those last few hundred pounds of yield cheaper or more expensive than the first one-thousand or so pounds? Are growers loosing more than they have to by keeping the crop in the field too long and running up additional cost which simply increase the farm's losses per acre, or per pound? (By the way, if What's a Loss Anyway? But do growers sometimes behave as if they feel that what they lose on each pound of cotton they can makeup for with increased volume? Are decisions being made consistent with the techni- Yield Increase, Percent The old story about the TV pitchman who claims to be selling his wares for the lowest possible price and is "losing money on every sale; but making up for his losses in volume" comes to my mind as the 1993 cotton year comes into this critical part of the growing season. Percent Increase in Upland Cotton Yield The near-term economic Required to Extend Season prospects are in a holding 70.0% pattern as prices continue low and conditions are hot 60.0% and dry. Growers are Long Season surely facing one of the most difficult times in re50.0% cent years and without the Full Season federal government's Cot40.0% ton Program they would be facing even rougher 30.0% times. Recent Prices Upland (¢/lb) Spot Target Price Loan Rate Dec '93 Futures 52.90 72.90 51.15 56.68 20.0% 10.0% 0.0% $0 Base yield 1,075 lb/acre $10 June 25, 1993 Pima (ELS) (¢/lb) 93.00 105.80 88.15 Note: Upland Spot for Desert SW grade 31, staple 35; Pima Spot for grade 03, staple 46, 6/18/93; Phoenix Loan Rates $20 $30 $40 $50 $60 $70 $80 Cost of Irrigation Water, $/Ac-Ft $90 $100 costs are fully accounted and include the "opportunity costs" of the equity value of land and other production capital, the unit is not important; i.e., losses per acre are the sum of losses per pound.) The above graph is a repeat of one used last year to illustrate the problem of extending the crop year, thereby, requiring more inputs to finish the season. The graph assumes that yields for a base "short season" are 1,075 lb/ acre and that cotton prices are at the national Issued in furtherance of Cooperative Extension work, acts of May 8 and June 30, 1914, in cooperation with the U. S. Department of Agriculture, James A. Christenson, Director, Cooperative Extension, College of Agriculture, The University of Arizona. The University of Arizona College of Agriculture is an equal opportunity employer authorized to provide research, educational information and other services only to individuals and institutions that function without regard to sex, race, religion, color, national origin, age, Vietnam Era Veteran's status, or handicapping condition. Estimated To-Date Production Costs $/lint lb (June 30) The following table gives estimated production costs/lb to-date. These costs include both growing and fixed or ownership costs and are based on the displayed target yields. Producers with higher yields will have lower costs/lb if input costs are the same. Growers with lower yields will have higher costs/lb. County Target Yield Yuma 1,300 1,300 1,100 1,250 1,300 1,100 700 1,050 850 La Paz Mohave Maricopa Pinal Pima Cochise Graham Greenlee Growing Costs June To Date .04 .04 .02 .02 .04 .06 .04 .06 .08 . 10 .13 .13 .11 .17 .13 .33 .20 .19 Fixed All Costs Cost To Date .25 .27 .23 .23 .26 .28 .42 .31 .36 .35 .40 .36 .34 .43 .41 .76 .51 .55 Note: Based on Wade, et al., “1992-93 Arizona Field Crop Budgets”, Various Counties, Arizona Cooperative Extension, Tucson, January 1992. target price (72.9 ¢/lb). At lower cotton prices the increase in yield required to justify extending the season are even higher. From the graph, if irrigation water prices (or pumping costs) are $50 /acre-foot, an almost 40% increase in yield is required to pay for the added irrigation and insect control costs. turns that exist in the crop at that time. The moral of the story that began this analysis is that true unit losses can not necessarily be compensated for by increased volume (or yield); and management strategies that increase individual yields by adding inputs may seriously damage the financial stability of a farm by increasing financial losses beyond the farmer's ability to bare their costs. The added argument that increased yields can only help in the future as new Farm Program yields are established is not currently valid. Of course, the USDA could come back at some future date and re-estimate farm yields for program payments. However, the likelihood of this happening is not very high in the current national budget deficit reduction mood. The price a farmer pays to have high yields is likely not worth the cost. The risk of following a strategy based on such an uncertain future is high. The economic (as well as agronomic) moral is make your crop early, protect it to early maturity and get the cotton out of the field as soon as you can. Lint Yield, lbs/acre As a postscript, please note that most government indicators show that Arizona's crop is (or at least was in early June) in very good shape. While recent near record heat may be As a point of reference, the graph below rapidly changing conditions, the chance to get shows the differences in yield for on full season strong growth in early summer is very good. cotton variety for several irrigation termiYield by Termination Date DLP 90, nation dates for 4 Maricopa, AZ, 1989 - 1992 years of research car1,700 ried out by Jeff Lines are simple linear curve fit Silvertooth, UA Extension Cotton SpecialÖ 1989 1,600 ist, and his associates. The graph shows that for even the best year 1,500 (1989), yields inÖ creased only between 1,400 10 and 20%. The message, although con1992 fused by the large 1990 1,300 F ã range of water prices F 1991 paid by farmers in Ariã zona, is that extendH 1,200 ing irrigation beyond F ã H H first or second week in 1,100 August likely conAug Wk1 Aug Wk 2 Aug Wk 3 Aug Wk 4 Sept Wk 1 Sept Wk 2 Sept Wk 3 Sept Wk 4 sumes some of the potential positive reDisclaimer: Neither the issuing individuals, originating unit, Arizona Cooperative Extension, nor the Arizona Board of Regents warrant or guarantee the use or results of this publication issued by the Arizona Cooperative Extension and its cooperating Departments and Offices.

