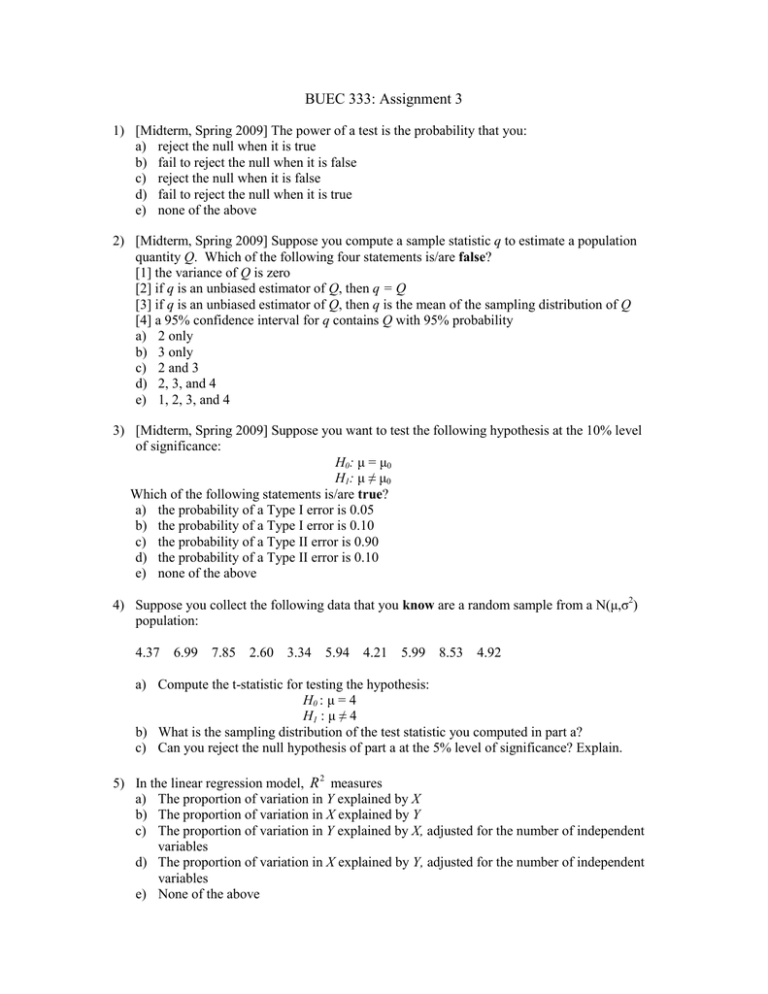
BUEC 333: Assignment 3
advertisement

BUEC 333: Assignment 3 1) [Midterm, Spring 2009] The power of a test is the probability that you: a) reject the null when it is true b) fail to reject the null when it is false c) reject the null when it is false d) fail to reject the null when it is true e) none of the above 2) [Midterm, Spring 2009] Suppose you compute a sample statistic q to estimate a population quantity Q. Which of the following four statements is/are false? [1] the variance of Q is zero [2] if q is an unbiased estimator of Q, then q = Q [3] if q is an unbiased estimator of Q, then q is the mean of the sampling distribution of Q [4] a 95% confidence interval for q contains Q with 95% probability a) 2 only b) 3 only c) 2 and 3 d) 2, 3, and 4 e) 1, 2, 3, and 4 3) [Midterm, Spring 2009] Suppose you want to test the following hypothesis at the 10% level of significance: H0: µ = µ0 H1: µ ≠ µ0 Which of the following statements is/are true? a) the probability of a Type I error is 0.05 b) the probability of a Type I error is 0.10 c) the probability of a Type II error is 0.90 d) the probability of a Type II error is 0.10 e) none of the above 4) Suppose you collect the following data that you know are a random sample from a N(µ,σ2) population: 4.37 6.99 7.85 2.60 3.34 5.94 4.21 5.99 8.53 4.92 a) Compute the t-statistic for testing the hypothesis: H0 : µ = 4 H1 : µ ≠ 4 b) What is the sampling distribution of the test statistic you computed in part a? c) Can you reject the null hypothesis of part a at the 5% level of significance? Explain. 5) In the linear regression model, R 2 measures a) The proportion of variation in Y explained by X b) The proportion of variation in X explained by Y c) The proportion of variation in Y explained by X, adjusted for the number of independent variables d) The proportion of variation in X explained by Y, adjusted for the number of independent variables e) None of the above 6) EVIEWS PART: Read Pendakur, Krishna and Ravi Pendakur, 2010, “Colour By Numbers: Minority Earnings Disparity 1995-2005”, forthcoming, Journal of Intenational Migration and Integration, linked on the course website. a) In your sample of data from people living in Greater Vancouver, select a sample which corresponds to the sample selected for regression estimation by Pendakur and Pendakur (2010). Note that while they use the entire sample of the long-form census file, you use only about one in seven observations from that file: the long-forms cover 20% of the population, but the public-use data that you have cover only 3% of the population. You will use this sample for all the questions below, too. How many observations do you have? Make a table showing the average earnings of white, visible minority and Aboriginal men and women (6 types) in this sample. b) Make a table showing the standard errors of the sample means you reported in part b. These standard errors equal the square-root of the variance of sampling distributions of the sample means in part b. c) Make a table showing the difference between the sample mean of white and visible minority and white and Aboriginal earnings for men and women (4 comparisons). Include the standard errors of these differences in this table. d) Construct test statistics for 4 hypotheses: the average earnings of visible minority men in the population is lower than that of white men; the average earnings of Aboriginal men in the population is lower than that of white men; the average earnings of visible minority women in the population is lower than that of white women; and the average earnings of Aboriginal women in the population is lower than that of white women. e) Run regressions like those in Table 2, corresponding to regressions controlling for personal characteristics only in Vancouver in 2005 (2006 microdata are about 2005 earnings). Be sure that you get the dependent variable correct. Report the output for the visible minority and Aboriginal coefficients only. f) Test the hypothesis that the mean log-earnings of visible minority men is lower than that of white men, and similarly for Aboriginal men, and similarly for women. g) How do your results differ from Pendakur and Pendakur (2010)? Why do they differ? h) Table 2 also considers regressions that control for work characteristics. How does their argument for the difference between these two variables connect with missing variables bias?


