BUEC 333---Fall 2010 Assignment #1 1)
advertisement

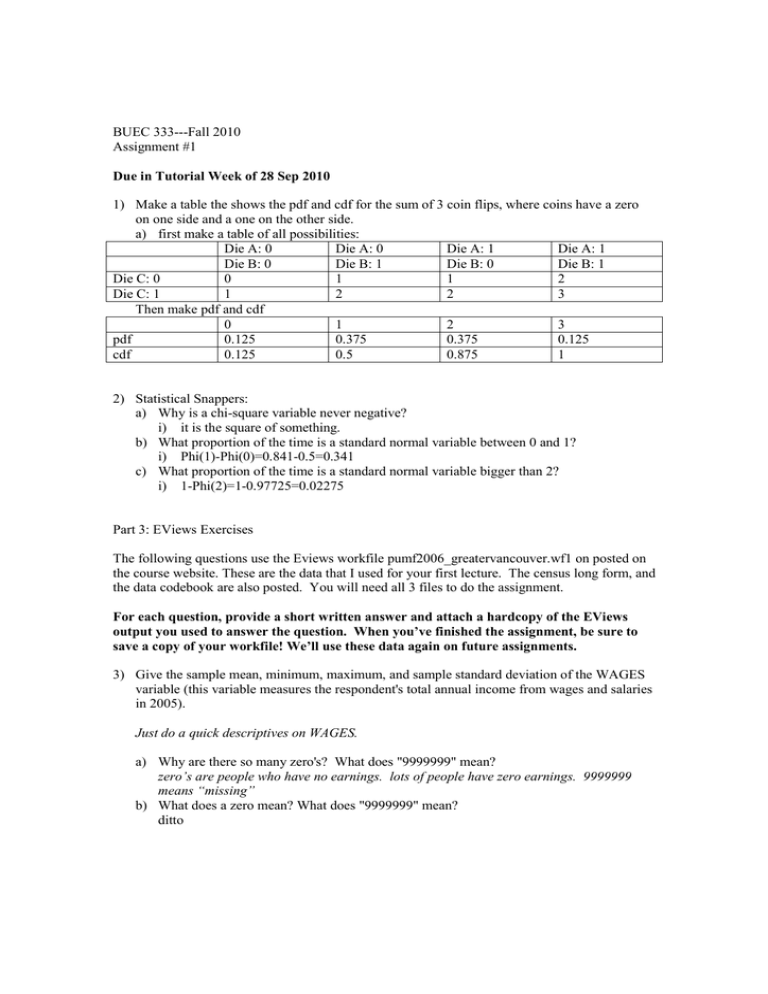
BUEC 333---Fall 2010 Assignment #1 Due in Tutorial Week of 28 Sep 2010 1) Make a table the shows the pdf and cdf for the sum of 3 coin flips, where coins have a zero on one side and a one on the other side. a) first make a table of all possibilities: Die A: 0 Die A: 0 Die A: 1 Die A: 1 Die B: 0 Die B: 1 Die B: 0 Die B: 1 Die C: 0 0 1 1 2 Die C: 1 1 2 2 3 Then make pdf and cdf 0 1 2 3 pdf 0.125 0.375 0.375 0.125 cdf 0.125 0.5 0.875 1 2) Statistical Snappers: a) Why is a chi-square variable never negative? i) it is the square of something. b) What proportion of the time is a standard normal variable between 0 and 1? i) Phi(1)-Phi(0)=0.841-0.5=0.341 c) What proportion of the time is a standard normal variable bigger than 2? i) 1-Phi(2)=1-0.97725=0.02275 Part 3: EViews Exercises The following questions use the Eviews workfile pumf2006_greatervancouver.wf1 on posted on the course website. These are the data that I used for your first lecture. The census long form, and the data codebook are also posted. You will need all 3 files to do the assignment. For each question, provide a short written answer and attach a hardcopy of the EViews output you used to answer the question. When you’ve finished the assignment, be sure to save a copy of your workfile! We’ll use these data again on future assignments. 3) Give the sample mean, minimum, maximum, and sample standard deviation of the WAGES variable (this variable measures the respondent's total annual income from wages and salaries in 2005). Just do a quick descriptives on WAGES. a) Why are there so many zero's? What does "9999999" mean? zero’s are people who have no earnings. lots of people have zero earnings. 9999999 means “missing” b) What does a zero mean? What does "9999999" mean? ditto c) Give the sample mean, minimum, maximum, and sample standard deviation of the WAGES variable excluding all the "9999999"s. Why is it so different? Are there other values of WAGES that should be excluded? series WAGES_MISSING=WAGES=9999999 or WAGES=8888888 dropping this gigantic number from the mean massively reduces the mean. 8888888 means not applicable. it should also be dropped. 4) Create a new variable called WAGES_MISSING that equals 1 if the WAGES variable is missing, and equals 0 otherwise. The sample mean of WAGES_MISSING measures the proportion of people for whom the WAGES variable is missing. Report this value. students should know that both 88888888 and 99999999 need to be excluded. proportion missing is 0.166923 5) Create a new variable called FULLTIME if the variable FPTWK has a value that corresponds with the respondent working mainly full time. series FULLTIME=FPTWK=1 6) What is the average number of WAGES given that the respondent worked mainly full time. What about when the respondent did not work mainly full time? (You have just computed 2 conditional means.) How do these values change if you only use data on respondents whose WAGES are not missing? series temp1=@mean(WAGES, "if FPTWK=1 and WAGES_MISSING=0") excluding missing 42188.70 Are the incomes of people from wages and salaries (given in the variable WAGES) very spread out? Report the mean and standard deviation of WAGES, and attach a histogram showing its distribution. print histogram 7) Create a variable COHORT that takes the values 1,2,3,4,5,6 for immigrant permanent residents arriving in the 1950s, 1960s, 1970s, 1980s, 1990s, 2000s, takes the value 7 for nonpermanent (temporary) residents, and takes the value 8 for Canadian-born (non-immigrant) people. there are many ways to do this, eg.: genr COHORT=YRIMM<1950 and IMMSTAT=2 a) Report the conditional mean of WAGES, for people with WAGE_MISSING=0, for each value of COHORT. this table may or may not control for fulltime status. students should say what they did. b) Do immigrants earn less than Canadian-born people? Give a table that shows this. the table that shows this should give means and might give std errs/std devs. students should say WHY they reach their conclusion. 8) Create a table of means, like in 11) above, that controls for age. controlling for age should be via making a 2 dimensional table of means, ie, cohort by age, with mean wage in each cell.. 9) Statistical Snappers: using Eviews' random number generator, create a variable called MYNORM that is distributed as a standard normal. Create another variable called MYCHI equal to its square. a) What proportion of MYCHI is negative? students should show that they did the simulation. none of it should be negative. b) What proportion of MYNORM is between 0 and 1? if students report the proportion for MYCHI, that’s okay. c) What proportion of MYNORM is bigger than 2? ditto d) Are these numbers different from what you answered in Question 4? Why? the simulation is only approximate


