The Big Impact From the Director Edition 3, September 2014
advertisement
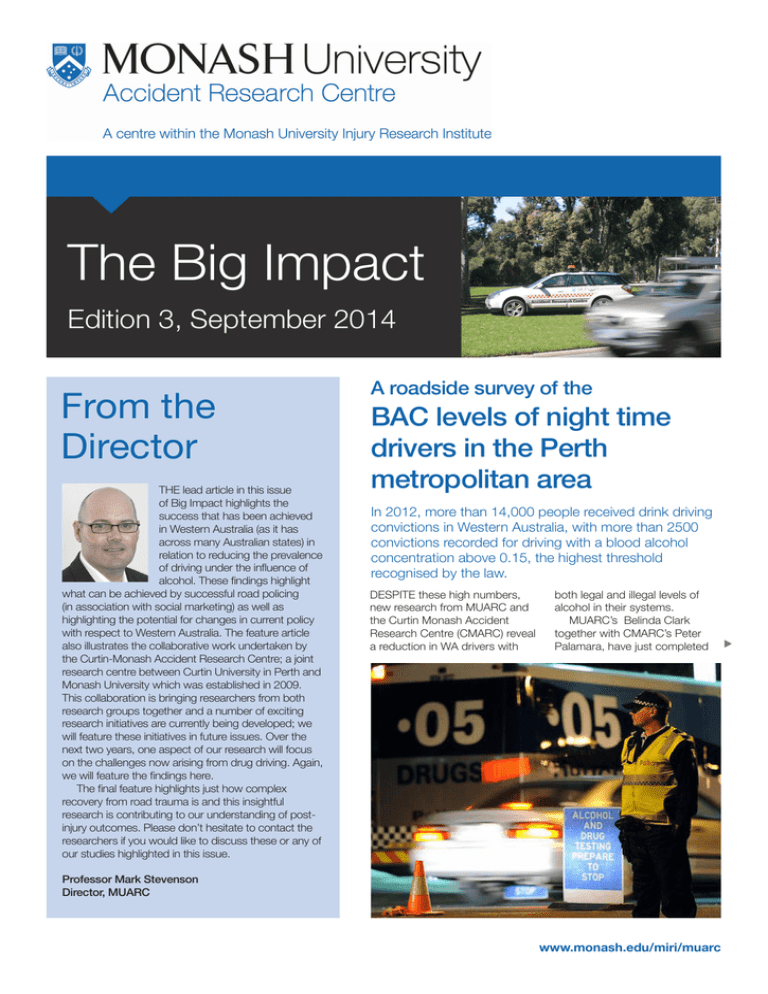
The Big Impact Edition 3, September 2014 From the Director THE lead article in this issue of Big Impact highlights the success that has been achieved in Western Australia (as it has across many Australian states) in relation to reducing the prevalence of driving under the influence of alcohol. These findings highlight what can be achieved by successful road policing (in association with social marketing) as well as highlighting the potential for changes in current policy with respect to Western Australia. The feature article also illustrates the collaborative work undertaken by the Curtin-Monash Accident Research Centre; a joint research centre between Curtin University in Perth and Monash University which was established in 2009. This collaboration is bringing researchers from both research groups together and a number of exciting research initiatives are currently being developed; we will feature these initiatives in future issues. Over the next two years, one aspect of our research will focus on the challenges now arising from drug driving. Again, we will feature the findings here. The final feature highlights just how complex recovery from road trauma is and this insightful research is contributing to our understanding of postinjury outcomes. Please don’t hesitate to contact the researchers if you would like to discuss these or any of our studies highlighted in this issue. A roadside survey of the BAC levels of night time drivers in the Perth metropolitan area In 2012, more than 14,000 people received drink driving convictions in Western Australia, with more than 2500 convictions recorded for driving with a blood alcohol concentration above 0.15, the highest threshold recognised by the law. DESPITE these high numbers, new research from MUARC and the Curtin Monash Accident Research Centre (CMARC) reveal a reduction in WA drivers with both legal and illegal levels of alcohol in their systems. MUARC’s Belinda Clark together with CMARC’s Peter Palamara, have just completed Professor Mark Stevenson Director, MUARC www.monash.edu/miri/muarc u A roadside survey of the BAC levels of night time drivers in the Perth metropolitan area continued a project comparing driver/rider blood alcohol content (BAC) levels obtained at Perth based Random Breath Test (RBT) booze bus sites, facilitated by the Western Australia Police. These findings were then compared with two similar studies conducted in 1999 (Ryan, 2000) and 2000 (Kirov, 2001); the study design replicated these two previous surveys in location, day of week and time of day. The findings identified a reduction in the proportion of drivers detected with both positive (but legal) as well as illegal BAC levels (≥0.05 g/100ml full licence holders or 0.02g/100ml learner, provision drivers), compared to data obtained in the 1999 and 2000 surveys. CMARC survey teams attended 36 RBT booze bus sites on Thursday, Friday and Saturday nights over a six week period during April-May 2012, all sites were located within the Perth metropolitan area. Demographic data was collected by the survey team about drivers/riders while stopped at the RBT site to provide a preliminary breath test (PBT) and included: gender, age, vehicle type, licence status. In addition, those who recorded a positive BAC reading (>zero) were asked to report the type of venue in which they’d consumed their last alcohol beverage. This demographic data was later matched with their BAC reading obtained from the police PBT. Of the 8,435 drivers tested, 1.4% were detected with an illegal BAC level, representing a significant reduction in the number of drivers detected with an illegal BAC compared to both of the two previous survey findings of 2.1% of drivers in 2000 and 1.9% in 1999. Amongst the drivers with illegal BACs there was .05 DRUGS 2 www.monash.edu/miri/muarc a smaller proportion of drivers detected (0.7%) in the current survey within the ≥0.05-0.079 g/100ml range compared to the two previous surveys (1.0% & 1.1% respectively). However, in the 0.08-0.149 g/100ml BAC range a greater proportion of drivers were detected in the current survey (1.5%) than in the 1999 survey (0.8%) and in 2000 (0.9%). The same proportion of drivers (0.1%) was detected in ≥0.15 g/100ml BAC range across all three surveys. Western Australia is the only Australian jurisdiction to apply the back-calculation process to BAC evidentiary tests. The application of the back-calculation process in this survey sample resulted in 26 drivers not receiving a drink driving charge and a further 65 drivers receiving a reduced charge ranging from one to four BAC charge levels lower. The findings suggest that the implementation of this backcalculation process may inadvertently favour drink drivers and therefore the cessation of this process warrants consideration. The authors recommend that in order to maximize both general and specific deterrence, regular RBT enforcement schedules should be extended into the early hours of the morning to reflect the evolving changes in socialisation and alcohol consumption patterns. Regular replication (annual or maximum every three years) of this type of survey will play a key role in monitoring drink driving patterns, and informing police RBT enforcement and drink driving countermeasures. .05 DRUGS Taking responsibility for an accident has a positive impact on health outcomes Special Guest Lecture Taking responsibility for a road accident is a strong indicator for how well a person will recover, according to a series of new studies from MUARC, Deakin, and Melbourne University researchers. THE study reveals that people who blame others for an accident have worse physical and mental health outcomes than those who take responsibility for the incident – even though the injuries may be the same. According to lead researcher, MUARC’s Jason Thompson, pictured bottom left, previous research has shown that people who receive compensation after accidents have worse outcomes than people who don’t, suggesting a link between the two. However all participants in the MUARC study had access to no-fault compensation through the TAC, suggesting that “something other than an effect of simply claiming compensation was going on,” Mr Thompson said. The study looked at over 1,000 people surveyed as part of the TAC’s regular client outcomes study during 2011. Questions related to their physical and mental health, their anxiety around traffic, levels of pain, and attributions of responsibility for the accident. The research revealed that – even after taking account of people’s injuries, age, gender, education, job status, and time since the crash, people who reported not being responsible for their accident had worse outcomes. “They were also far less satisfied with the compensation services they had received”, it was reported. The researchers say that the implications for insurers, medical professionals, and employers are great as they show that recovery, satisfaction with care, and time off work is closely related to the way accidents occur. “People might wonder why it takes one person so much longer than another to recover from similar injuries in a car accident. It might be that the crash circumstances were very different”, Mr Thompson said. The research has already assisted the TAC to understand and identify those at greater risk of experiencing poor post-accident recoveries, enabling them to be managed by the most appropriate rehabilitation teams earlier on in the claims process. This assists to reduce ‘claim movement’, which can be a source of frustration for clients who must then deal with multiple rehabilitation managers. The series of studies will appear over the coming months in US Journal Rehabilitation Psychology, and UK Journal Clinical Rehabilitation. Dr Nicole van Nes, senior researcher with the Dutch National Road Safety Research Institute in the Netherlands, gave a lecture in July. The capacity audience heard Dr van Nes discuss the interplay between technology and behaviour – and importantly, how to achieve desired behaviour through design. Currently the coordinator of the 10 million euro EUfunded large scale European Naturalistic Driving Study, UDRIVE, Dr van Nes has also been a key player in the first European Naturalistic Driving initiatives and she participated in the European Naturalistic Driving projects INTERACTION, DaCoTa and PROLOGUE. Dr van Nes was a Research Fellow at MUARC in 2008/9 and MUARC Director, Professor Mark Stevenson, said that it was terrific to welcome Dr van Nes back to MUARC and pleasing to see large numbers attending the lecture, which is an indication of the enormous interest in naturalistic driving studies as a way to better understand the key factors associated with driving performance. www.monash.edu/miri/muarc 3 Below are MUARC publications this quarter: Johnson M; Oxley J; Newstead S; Charlton C. Safety in numbers? Investigating Australian driver behaviour, knowledge and attitudes towards cyclists. Accident Analysis and Prevention 2014. 70:148-154. Candappa, N; Logan D; van Nes N; Corben B. An exploration of alternative intersection designs in the context of Safe System. Accident Analysis and Prevention. 2014. Doi:10.1016/j.aap.2014.07.030 Hughes P; Newstead S; Shafieri S; Hopkins J. Data foundations for relationships between economic and transport factors with road safety outcomes. Journal Australian College of Road Safety. 2014. Vol 25(3): 41-49. Lansdown T; Stephens A; Walker G. Multiple driver distractions: A systematic transport problem. Accident Analysis and Prevention. 2014. DOI: 10.1016/j.aap.2014.07.006 Read G; Salmon P; Lenne M. Cognitive work analysis and design: Current practice and future practitioner requirements. Theoretical Issues on Ergonomic Science: http://dx.doi.org/10.10 80/1463922X.2014.930935 Further information Monash University Accident Research Centre (MUARC) Building 70, Clayton Campus Monash University, VIC 3800 Telephone: +61 3 9905 4371 Email: miri-enquiry@monash.edu 4 www.monash.edu/miri/muarc Kuo, J; Koppel S; Charlton J; Rudin-Brown C. Computer vision and driver distraction: Developing a behaviour-flagging protocol for naturalistic driving data. Accident Analysis and Prevention. Vol 72. 177-183. Stevenson M. Epidemiology and transport: good science is paramount. Injury Prevention doi:10.1136/ injuryprev-2014-041392 Newstead S; Watson L; Cameron M. Vehicle Safety Ratings Estimated from Police Reported Crash Data: 2014 update. www.monash.edu/miri/ research/reports/muarc321pdf
