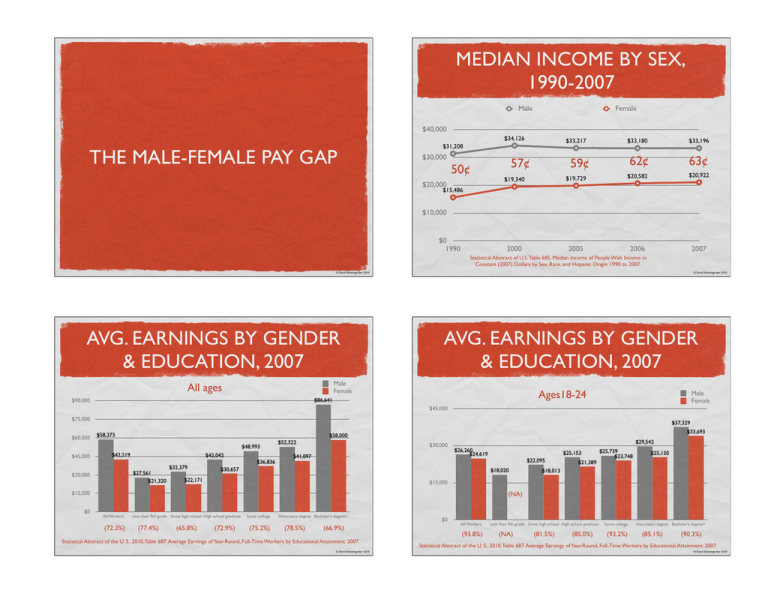
MEDIAN INCOME BY SEX, 1990-2007 THE MALE-FEMALE PAY GAP 63¢
advertisement

MEDIAN INCOME BY SEX, 1990-2007 Male Female $40,000 $34,126 THE MALE-FEMALE PAY GAP $33,217 $31,208 $30,000 57¢ 50¢ $20,000 $33,196 $33,180 59¢ 62¢ 63¢ $20,922 2007 $19,340 $19,729 $20,582 2000 2005 2006 $15,486 $10,000 $0 1990 Statistical Abstract of U.S. Table 685. Median Income of People With Income in Constant (2007) Dollars by Sex, Race, and Hispanic Origin: 1990 to 2007. © David Schweingruber 2010 AVG. EARNINGS BY GENDER & EDUCATION, 2007 © David Schweingruber 2010 AVG. EARNINGS BY GENDER & EDUCATION, 2007 Male Female All ages Ages18-24 $86,641 $90,000 Male Female $45,000 $75,000 $60,000 $37,329 $58,373 $48,993 $45,000 $42,219 $42,042 $27,561 $21,320 $30,000 $33,693 $58,000 $32,379 $36,836 $52,322 $30,000 $41,097 $29,542 $26,260 $24,619 $30,657 $18,020 $22,171 $21,389 $25,739 $23,748 $25,130 $18,013 $15,000 $15,000 $0 $25,153 $22,095 (NA) All Workers (72.3%) Less than 9th grade Some high school High school graduate (77.4%) (65.8%) (72.9%) Some college (75.2%) Associate’s degree Bachelor’s degree+ (78.5%) (66.9%) Statistical Abstract of the U. S., 2010. Table 687. Average Earnings of Year-Round, Full-Time Workers by Educational Attainment: 2007. © David Schweingruber 2010 $0 All Workers (93.8%) Less than 9th grade Some high school High school graduate (NA) (81.5%) (85.0%) Some college (93.2%) Associate’s degree Bachelor’s degree+ (85.1%) (90.3%) Statistical Abstract of the U. S., 2010. Table 687. Average Earnings of Year-Round, Full-Time Workers by Educational Attainment: 2007. © David Schweingruber 2010 WHEN DO MEN MAKE MORE THAN WOMEN? WAGE GAP IN 10 MOST COMMON OCCUPATIONS FOR WOMEN, 2009 1. Different work choices Median Weekly Earnings for Men Median Weekly Earnings for Women Women’s Earnings as percent of men’s Share of Female Workers in Occupation All Workers $819 $657 80.2% 44.8% Secretaries and administrative assistants $666 $619 92.9% 96.9% Elementary & middle school teachers $1,040 $891 85.7% 81.3% Registered Nurses $1,040 $1,035 95.0% 90.7% $519 $430 82.9% 88.0% Historically, employers (and unions) believe that men, but not women, needed a family wage Nursing, psychiatric and home health aides First-line supervisors/managers of retail sales workers $770 $597 77.5% 44.4% “Comparable worth” has not been successfully implemented First-line supervisors/managers of office and administrative support workers $837 $705 84.2% 68.9% Customer service representatives $617 $587 95.1% 66.7% Cashiers $422 $361 85.5% 70.7% Accountants and auditors $1,190 $902 75.8% 61.1% Managers, all other $1,292 $1,037 80.3% 38.0% However, women’s choices may be constrained by education, home-work conflict and the family wage gap. However, work choices and human capital don’t explain most of the pay gap 2. Occupational segregation: (1) men and women work different jobs and (2) femaledominated jobs are paid less than male-dominated ones 3. Occupation-wide pay discrimination: women are paid less for the same jobs 4. promotion gap produced by “glass ceilings,” “glass escalators” & other processes 5. Organization-level pay discrimination, e.g., Wal-Mart Institute for Women’s Policy Research, Fact Sheet: The Gender Wage Gap by Occupation (April 2010) © David Schweingruber 2010 WAGE GAP IN 10 MOST COMMON OCCUPATIONS FOR MEN, 2009 Median Weekly Earnings for Men Median Weekly Earnings for Women Women’s Earnings as percent of men’s Share of Female Workers in Occupation © David Schweingruber 2010 WAGE GAP IN 10 HIGHEST PAYING OCCUPATIONS FOR WOMEN, 2009 Median Weekly Earnings for Men Median Weekly Earnings for Women Women’s Earnings as percent of men’s Share of Female Workers in Occupation All Workers $819 $657 80.2% 44.8% All Workers $819 $657 80.2% 44.8% Driver/sales workers and truck drivers $690 $512 74.2% 3.7% Chief executives $2,084 $1,553 74.5% 24.3% Managers, all other $1,292 $1,037 80.3% 38.0% Pharmacists $1,954 $1,475 75.5% 43.0% 44.4% Lawyers $1,934 $1,449 74.9% 36.6% First-line supervisors/managers of retail sales workers $770 Janitors and building cleaners $484 $401 81.2% 26.5% Computer and information system managers $1,788 $1,411 78.9% 27.7% Retail salespersons $624 $443 71.0% 42.8% Computer software engineers $1,550 $1,311 84.6% 21.3% Laborers and freight, stock, and material movers, hand $511 $421 82.4% 13.4% Physicians and surgeons $1,914 $1,228 64.2% 34.3% Construction laborers $595 NA NA 2.3% Computer programers $1,267 $1,182 93.3% 21.1% Chief executives $2,084 $1,553 74.5% 24.3% Management analysts $1,371 $1,177 85.8% 47.4% Sales representatives, wholesale and manufacturing $986 $736 74.6% 26.8% Computer scientists and systems analysts $1,268 $1,167 92.0% 27.8% Cooks $400 $371 92.8% 36.7% Occupational therapists NA $1,155 NA 81.7% $597 77.5% Institute for Women’s Policy Research, Fact Sheet: The Gender Wage Gap by Occupation (April 2010) © David Schweingruber 2010 Institute for Women’s Policy Research, Fact Sheet: The Gender Wage Gap by Occupation (April 2010) © David Schweingruber 2010 WAGE GAP IN 10 LOWEST PAYING OCCUPATIONS FOR WOMEN, 2009 Median Weekly Earnings for Men Median Weekly Earnings for Women Women’s Earnings as percent of men’s Share of Female Workers in Occupation All Workers $819 $657 80.2% 44.8% Miscellaneous agricultural workers $405 $346 85.4% 15.0% Combined food preparation and serving workers, including fast food $357 $347 97.2% 64.3% Cashiers $422 $361 85.5% 70.7% Laundry and dry-cleaning workers $493 $362 73.4% 60.4% Waiters and waitresses $419 $363 86.6% 65.5% Child care workers NA $364 NA 95.6% Food preparation workers $385 $367 95.3% 51.8% Cooks $400 $371 92.8% 36.7% Maids and housekeeping cleaners $444 $371 83.6% 87.1% Sewing machine operators NA $383 NA 70.1% Institute for Women’s Policy Research, Fact Sheet: The Gender Wage Gap by Occupation (April 2010) © David Schweingruber 2010


