Survey Summary
05/07/2007 02:42 PM
Monday, May 07, 2007
Results Summary
Show All Pages and Questions
Filter Results
Share Results
To analyze a subset of your data,
you can create one or more filters.
Your results can be shared with others,
without giving access to your account.
Total:
49
Status:
Visible: 49
Enabled
Reports: Summary and Detail
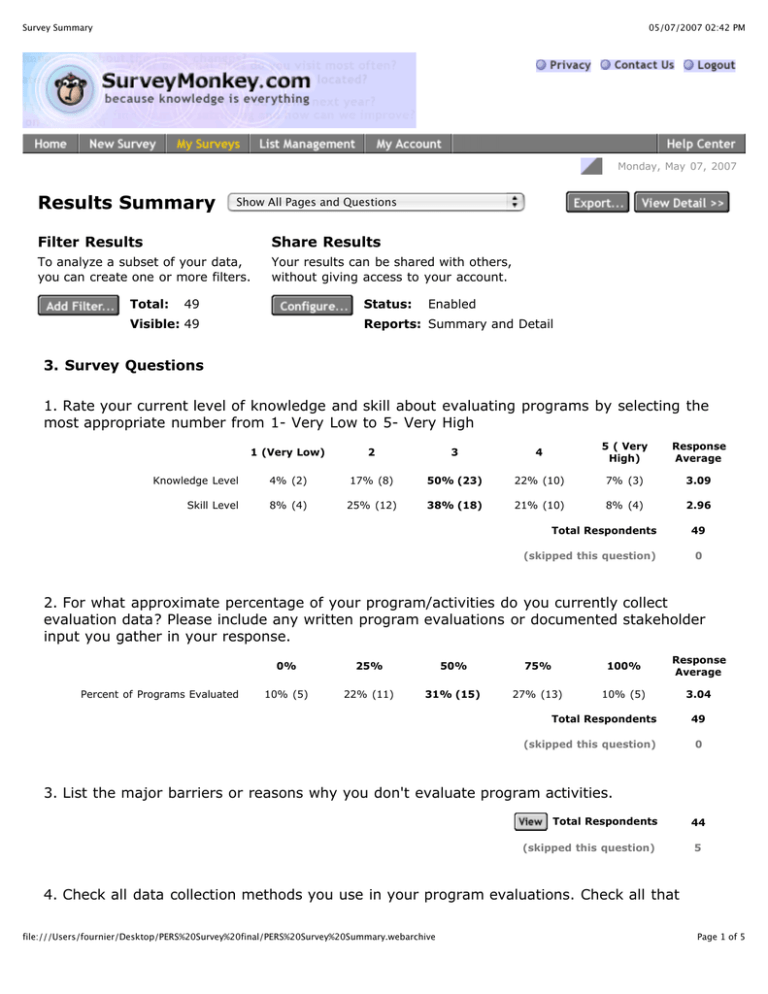
3. Survey Questions
1. Rate your current level of knowledge and skill about evaluating programs by selecting the
most appropriate number from 1- Very Low to 5- Very High
1 (Very Low)
2
3
4
5 ( Very
High)
Response
Average
Knowledge Level
4% (2)
17% (8)
50% (23)
22% (10)
7% (3)
3.09
Skill Level
8% (4)
25% (12)
38% (18)
21% (10)
8% (4)
2.96
Total Respondents
49
(skipped this question)
0
2. For what approximate percentage of your program/activities do you currently collect
evaluation data? Please include any written program evaluations or documented stakeholder
input you gather in your response.
Percent of Programs Evaluated
0%
25%
50%
75%
100%
Response
Average
10% (5)
22% (11)
31% (15)
27% (13)
10% (5)
3.04
Total Respondents
(skipped this question)
49
0
3. List the major barriers or reasons why you don't evaluate program activities.
Total Respondents
(skipped this question)
44
5
4. Check all data collection methods you use in your program evaluations. Check all that
file:///Users/fournier/Desktop/PERS%20Survey%20final/PERS%20Survey%20Summary.webarchive
Page 1 of 5
Survey Summary
05/07/2007 02:42 PM
apply.
Response Response
Percent
Total
Pre and post evaluations
68.1%
32
End-of-program evaluation
immediately following the
program
85.1%
40
Follow-up evaluation conducted 30
days or more after a program
27.7%
13
Needs Assessment conducted at an
early stage of program development
66%
31
Mid-term Assessment to determine if
programs are on course
25.5%
12
Written Surveys
68.1%
32
Phone Surveys
23.4%
11
Online Surveys
21.3%
10
Focus Groups
42.6%
20
Interviews
55.3%
26
Other (please specify)
29.8%
14
Total Respondents
47
(skipped this question)
2
5. Check all types of data that you try to collect in your program evaluations. Check all that
apply.
Response Response
Percent
Total
Data to identify issues clientele feel
are important (needs assessment)
73.9%
34
Data to determine overall client
satisfaction with a program
78.3%
36
Data to determine client satisfaction
with specific portions of a program
69.6%
32
Data to measure a change in
participant knowledge
80.4%
37
Data to measure a change in
participant skills
71.7%
33
Data to measure a change in
participant attitudes
56.5%
26
Data to measure a change in
participant behavior (e.g., adoption
of a specific practice)
65.2%
30
Data to measure a participant’s
intention to change a behavior or
adopt a practice
65.2%
30
Data to measure a program’s impact
beyond a single client (e.g., changes
in community practices, influence of
client networks)
41.3%
19
Data to measure a program’s long-
file:///Users/fournier/Desktop/PERS%20Survey%20final/PERS%20Survey%20Summary.webarchive
Page 2 of 5
Survey Summary
05/07/2007 02:42 PM
Data to measure a program’s longterm impact (e.g., one or more years
after a program)
Data to measure program adoption
and/or diffusion
Other (please specify)
37%
17
39.1%
18
8.7%
4
Total Respondents
46
(skipped this question)
3
6. How important on a scale of 1(Not Important) to a 5 (Very Important) do you feel it is for
you to improve your knowledge and skills about program evaluation?
Importance
1 (Not
Important)
2
3
4
5 (Very
Important)
Response
Average
4% (2)
2% (1)
24% (12)
16% (8)
53% (26)
4.12
Total Respondents
49
(skipped this question)
0
7. What specific types of programs or projects would you like to know more about evaluating?
Total Respondents
35
(skipped this question)
14
8. What practical outcomes or benefits do you hope to gain from improving your program
evaluation knowledge and skills?
Total Respondents
36
(skipped this question)
13
9. Rate your level of interest in each of the following topics or venues for learning more about
program evaluation. Rank from 1 (low) to 5 ( high):
1 (Low)
2
3
4
5(High)
Response
Average
14% (7)
16% (8)
27% (13)
31% (15)
12% (6)
3.10
Measuring Project Outcomes/Impacts
6% (3)
4% (2)
25% (12)
40% (19)
25% (12)
3.73
Assessing Client Needs
6% (3)
2% (1)
38% (18)
42% (20)
12% (6)
3.52
Evaluation for Improving Programs
4% (2)
22% (11)
29% (14)
22% (11)
22% (11)
3.37
Conducting Surveys
15% (7)
19% (9)
38% (18)
17% (8)
12% (6)
2.94
Writing Objectives and Outcomes
12% (6)
16% (8)
35% (17)
22% (11)
14% (7)
3.10
Conducting Focus Groups
15% (7)
25% (12)
31% (15)
23% (11)
6% (3)
2.81
Qualitative Data Analysis
11% (5)
6% (3)
47% (22)
23% (11)
13% (6)
3.21
Conducting Interviews
12% (6)
15% (7)
48% (23)
19% (9)
6% (3)
2.92
Program Evaluation Basics
file:///Users/fournier/Desktop/PERS%20Survey%20final/PERS%20Survey%20Summary.webarchive
Page 3 of 5
Survey Summary
05/07/2007 02:42 PM
Statistics
IRB Requirements (Human Subjects)
18% (9)
18% (9)
24% (12)
27% (13)
12% (6)
2.96
28% (13)
22% (10)
22% (10)
13% (6)
15% (7)
2.65
Total Respondents
49
(skipped this question)
0
Total Respondents
8
10. List other topics:
(skipped this question)
41
11. Preferred Tools or Resources Rank from 1( Low) to 5 (High).
1 (Low)
2
3
4
5 (High)
Response
Average
One-on-one Counseling
35% (15)
7% (3)
28% (12)
19% (8)
12% (5)
2.65
Workshop (face-to-face)
9% (4)
13% (6)
15% (7)
32% (15)
32% (15)
3.66
Community of Learners (community
where learners share skills and
knowledge)
9% (4)
22% (10)
22% (10)
26% (12)
22% (10)
3.30
27% (12)
23% (10)
27% (12)
18% (8)
5% (2)
2.50
Web Resources
16% (7)
9% (4)
36% (16)
25% (11)
14% (6)
3.11
Interactive CD
27% (12)
25% (11)
32% (14)
9% (4)
7% (3)
2.43
21% (9)
12% (5)
28% (12)
21% (9)
19% (8)
3.05
9% (4)
16% (7)
29% (13)
27% (12)
20% (9)
3.33
Workshop (web conference)
Library of Evaluation Instruments
Program Planning Tools
Total Respondents
48
(skipped this question)
1
Total Respondents
3
12. List other Tools and Resources not listed:
(skipped this question)
46
13. Other Comments/Suggestions:
Total Respondents
(skipped this question)
4
45
14. To better facilitate future trainings, please check your location.
Response Response
Percent
Total
file:///Users/fournier/Desktop/PERS%20Survey%20final/PERS%20Survey%20Summary.webarchive
Page 4 of 5
Survey Summary
05/07/2007 02:42 PM
Off-campus
63.3%
31
On-campus
36.7%
18
Total Respondents
49
(skipped this question)
0
15. Please indicate your years with Extension.
Response Response
Percent
Total
0 to 5 years
28.6%
14
6 to 10 years
20.4%
10
11 to 15 years
12.2%
6
16 to 20 years
16.3%
8
21+ years
22.4%
11
Total Respondents
49
(skipped this question)
0
SurveyMonkey is Hiring! | Privacy Statement | Contact Us | Logout
Copyright ©1999-2006 SurveyMonkey.com. All Rights Reserved.
No portion of this site may be copied without the express written consent of SurveyMonkey.com.
file:///Users/fournier/Desktop/PERS%20Survey%20final/PERS%20Survey%20Summary.webarchive
Page 5 of 5


