Document 10591943
advertisement
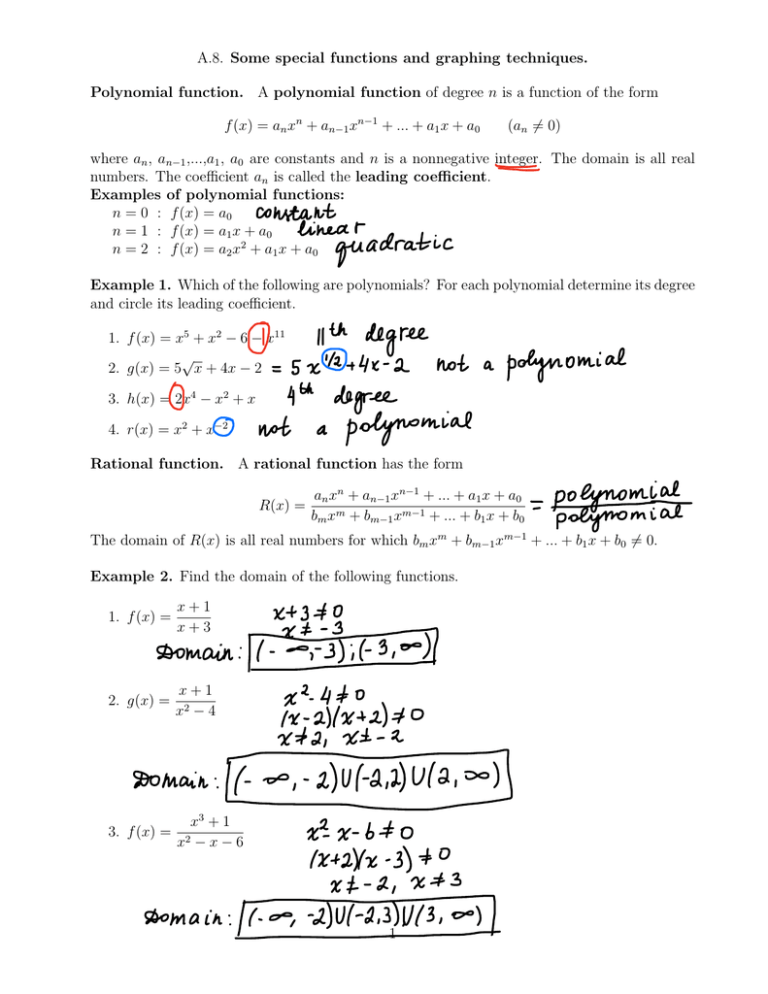
A.8. Some special functions and graphing techniques. Polynomial function. A polynomial function of degree n is a function of the form f (x) = an xn + an 1 xn 1 + ... + a1 x + a0 (an 6= 0) where an , an 1 ,...,a1 , a0 are constants and n is a nonnegative integer. The domain is all real numbers. The coefficient an is called the leading coefficient. Examples of polynomial functions: n = 0 : f (x) = a0 n = 1 : f (x) = a1 x + a0 n = 2 : f (x) = a2 x2 + a1 x + a0 Example 1. Which of the following are polynomials? For each polynomial determine its degree and circle its leading coefficient. 1. f (x) = x5 + x2 6 x11 p 2. g(x) = 5 x + 4x 2 3. h(x) = 2x4 x2 + x 4. r(x) = x2 + x 2 Rational function. A rational function has the form R(x) = an xn + an 1 xn 1 + ... + a1 x + a0 bm xm + bm 1 xm 1 + ... + b1 x + b0 The domain of R(x) is all real numbers for which bm xm + bm 1 xm Example 2. Find the domain of the following functions. 1. f (x) = x+1 x+3 2. g(x) = x+1 x2 4 3. f (x) = x3 + 1 x2 x 6 1 1 + ... + b1 x + b0 6= 0. Power function. A power function is a function of the form f (x) = kxr where k and r are any real numbers. Examples of power functions. 1. r = n, n is a positive integer. Then f (x) is a polynomial with only one term. Domain is 2. r = p 1 , n is a positive integer. Then f (x) = x1/n = n x is a root function. n p p f (x) = x f (x) = 3 x Domain is Domain is 1 is a reciprocal function. x Its graph is a hyperbola with coordinate axes as its asymptotes. 3. r = 1. Then f (x) = x 1 = Domain is NOTE: your calculator may graph power functions incorrectly when r = y = xm/n , try y = (xm )1/n or y = (x1/n )m 2 m . Instead of entering n Graphing technics Vertical shift. For k > 0, the graph of y = f (x) + k is the graph of y = f (x) shifted upward by k units, while the graph of y = f (x) k is the graph of y = f (x) shifted downward by k units. Example 3. Graph y = x2 , y = x2 + 1, and y = x2 2 on the same graph. Horizontal shift. For c > 0, the graph of y = f (x c) is the graph of y = f (x) shifted to the right by c units, while the graph of y = f (x + c) is the graph of y = f (x) shifted to the left by c units. Example 4. Graph y = x2 , y = (x 2)2 , and y = (x + 1)2 on the same graph. 3 Reflection. The graph of y = f (x) is the reflection of the graph y = f (x) in the x-axis. Example 5. Graph y = x2 and y = x2 on the same graph. Expansion and Contraction. For a > 0, the graph of y = af (x) is an expansion (vertically) of the graph of y = f (x) if a > 1, and a contraction (vertically) of the graph of y = f (x) if 0 < a < 1. Example 6. Graph y = x2 , y = 2x2 , and y = 0.5x2 on the same graph. 4 Example 7. How is the graph of y = 4 Example 8. How is the graph of y = 1 + |x + 1| found from the graph of y = |x|? p x 1 found from the graph of y = p x? NOTE: the order of transformations is important. Perform the transformations in the order you would perform the mathematical calculations for each value of x when determining the resulting y-value. 5
