Document 10590724
advertisement
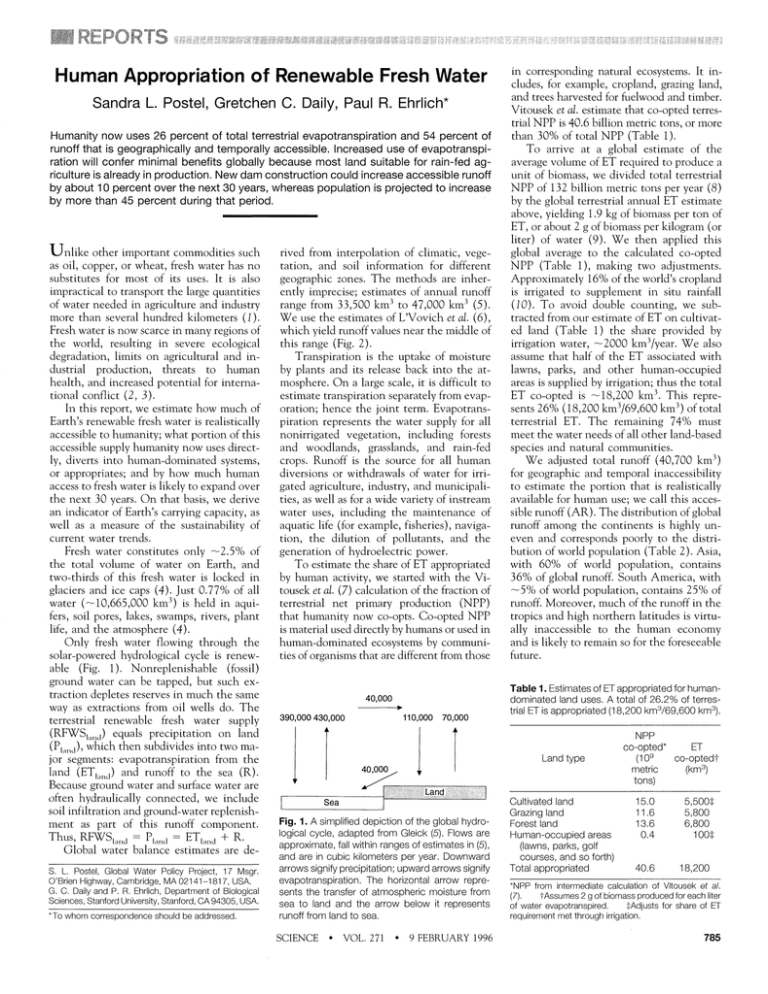
The Amazon River accounts for 15% of global runoff ( 1). It is currently accessible, however, to -25 million people (12) 0.4% of world population and no massive expansion of irrigation is likely that would warrant major diversiolnsfrom it. We thus consider 95% of its flow inaccessible. The Zaire-Congo ranks second in global runoff (3.5% of the total) (11) and supports -1.3% of world population (12). We judge half of its flow to be inaccessible for purposes of irrigation and in-duLstrial and municipal use over the next 30 years. The final subtraction is for the remote rivers of North America and Eurasia, 55 of which have no dams on their main channels (13). Most of this river flow is in tundra and taiga biomes that are remote from population centers. The combined average annual flow of these northern untapped rivers is 1815 km3/year,and we subtract 95% of it. Together, the inaccessible remote flows of the Amazon, Zaire-Congo, and northel-rntier uindevelopedrivers amount to 7774 km3 per year (Table 3), or 19% of total annual ruLnoff. This leaves -32,900 km3 geographically accessible. Our estimate is conservative because we made no subtractions for 10,300 |(1 Total many (particularly northern) rivers that have very large flows relative to the human population size and water needs of their geographic areas (14). We next adjusted for temporal inaccessibility. Irrigated agriculture, industry, and households require that water be supplied when and where it is needed. This degree of control over runoff is not easy to achieve. Approximately 11,100 km3 of global runoff (-27% of the total) is renewable ground water and base river flow (6). As long as extraction does not exceed replenishment, these souLrcescan provide a reliable renewable supply. The remaining runoff, -29,600 kmi3, is much harder to capture, because most of it is flood water. In Asia, for instance, 80% of runoff occurs from May to October (4, 15). Capturing flood runoff generally requires the construction of dams. The present storage capacity of large dams collectively totals 5500 kmi3,of which 3500 km3 is actively used in the regulation of river runoff (6, 16). Adding together the base flow and the surface runoff controlled by dams gives an estimate of the total stable flow. Assuming that the geographically accessible ruLnoffis l km3/year) 1 K Total runoff (40,700 km3/year) evapotranspiration onland 0. (69,600 km3/year) e *0 e ~~~~~~Remote flow ~~~~~~~~~(7774 km3/year) Uncaptured floodwater (20,426 km3/year) Geographically and temporally accessible runoff (AR) (122,500 Human appropriation of ET [1[8,200 km3/year (26%)] km3/yea(r) Withdrawals Instream uses [4430 km3/year (35%)] [2350 km3/year (1 9%)] Human appropriation of AR [6780 km3/year (54%)] Human km3/year (30%)] Human appropriation of total RFWSland [24,980 km3/year (23%) Fig. 2. Flow diagram of analysis of human appropriation of RFWSland' The final box shows human appropriation of estimated accessible RFWSla,-ndto be 30% (24,980 km3/82,1 00 km3) and hutman appropriationof total RFWSIand to be 23% (24,980 km3/110,300 km3). 786 SCIENCE * VOL. 271 n third use; and (iii) huLmaninstream flow needs. Together,withdrawalsand instream uses providea measLreof hLuman appropriation of runoff,and we estimatethem separatelyhere. uses by far the most AR AgricuLlture worldwide. We estimated agriculttLral water withdrawalsby mLltiplyingan averagewater applicationrateof 12,000 m3/ha (17) by the 1990 estimateof 240 millionhectaresof worldirrigatedarea(10). This yieldsa total water demand of -2880 km3 agricuLltural (Table 4). The ratio of consumption to withdrawalsvarieswith climaticfactors,the cropsgrown,and irrigationefficiency,and typicallyrangesbetween 50 and 80% (4). We assUrme that -65%of agricultuLral water withdrawalsareconsumed,for a globaltotal of 1870 km3. Industrialwater use has leveled off or declined in many wealthier countries, but is growing rapidly in much of the developing world(2). Shiklomanov(4) estimatedthat ulseis -975 km3 globally,includinduLstrial In ing the thermoelectricpower induLstry. contrastto agricuLlture, only a smallshareof waterulsedin induLstry is consumed;most of it is dischargedback to the environment, Table 2. Share of global runoffand population by continent. Region appropriation of accessible RFWSt ama [24,980 dividedbetweenbase and flood flow in the same proportionthat total ruLnoffis, we then reducedthe estimateof total baseflow by the shareof it contained in the remote rivers,2100 km3 (0.27 X 7774 kim3), leading to an accessiblebase flow of 9000 km3 (11,100 - 2100). Addition to this of the estimated3500 km3 of ruLnoff regulatedby existing reservoirsyields an estimate of presenttotal AR of 12,500 km3/year. We next estimatedwhat portionof AR humanitynow uses.Threecategoriesof water use are (i) withdrawalsor abstractions, which representwaterremovedfromrivers, lakes, and aquifersfor human activities (alsoknownas waterdemandor wateruse); (ii) consumption,which refersto withdrawals that are not availablefor a second or 9 FEBRUARY1996 Europe Asia Africa North and Central America South America Australiaand Oceania Totals Share of Total river global runoff* river runoff (km3/ Share of global populationt year) (%) (%) 3,240 14,550 4,320 6,200 8.0 35.8 10.6 15.2 13.0 60.5 12.5 8.0 10,420 1,970 25.6 4.8 5.5 0.5 100.0 100.0 40,700 *Runoff estimates from (6). from (32). -IPopulation estimates REPORTS Table 3. Estimates of inaccessible runoff of selected. remote rivers. this rate to the 1990 population yields a dilution requirement of -4700 km3. If 50% of MLunicipaland induLstrialwaste Remote flow globally receives at least secondary treatRiverbasin or region (km3/year) ment before discharge (20), then the instream flow requlirement is 2350 km3/year. Amazon* (95% of total flow) 5387 In actuality, some dilution is accomZaire-Congo* (50% of total) 662 Remote undammed northern plished by flood flows rather than by AR, riversi-(95% of totals) and some additional pollution comes from North America 979 sources, dispersed (such as agricuLltuLral) Eurasia 746 but because we are using the dilution reTotal inaccessible remote 7774 qulirement as a proxy for instream uses runoff generally, we made no adjustments for *Amazonand Zaire-Congorunofffrom(11). -I-Norththese (21). ernriversfrom(13). Overall, we estimate that --18% of AR (2285 km3/12,500 kn3) is now consumed although it is often polluted. Some 9% or directly for human purposes. Withdrawals -90 km3 of induLstrialwater withdrawals from rivers, streams, and aquifers combined are consumed. with instream flow requirements total 6780 MuLnicipal ulse varies greatly among kmi3, which suLggeststhat an additional countries and regions. Shiklomanov (4) ac36% for a total of 54% of AR (6780 counted separately for uirbanand rural inkm3/12,500 km3 is currently appropriated habitants, using country-level data on demfor huLmanpLrposes. We estimate that huographic characteristics and water ulse. His man uIseof ET and rulnoffconstitultes 30% estimated worldwide muLnicipaluse is 300 of the total accessible RFWS [(18,200 km3 km3 per year, of which -50 km3 (or -17%) + 6780 km-3)/(69,600 km3 + 12,500 kim3)]. This is conservative, because it assumes that is consumed. In certain geographic regions, reservoir all ET is accessible (22). Comparison of losses to evaporation constituLtea suLbstan- human Ise with the total unadjusted RFWS tial share of total ruLnoff(18). We assuLme indicates that Homo satpienlsis co-opting that an average of 5% of the gross storage -23% of this life-suLpportresouLrce(18,200 km3 + 6780 km3/110,300 kiM3). capacity of reservoirsworldwide (5500 kim3) is lost to evaporation, or 275 kmn3/year. How mulch can AR be expected to inInstream flow ulses include maintecrease duLringthe next three decades? The nance of navigation paths, water qLality, principal means of expanding AR is to capriver deltas, fisheries, wildlife, riparian tulre and store mloreflood rulnoffor to devegetation, other aquatic biodiversity, and salinate seawater. Exotic options, such as recreational opportunities. Becaulse intowing icebergs, are uinlikelyto yield apprestream requlirements vary geographically ciable qulantities of water on a global basis and seasonally, we ulsedpollution diluLtion in the next 30 years. as a global proxy and assuLmedthat the Desalination, which suLpplies-0.1% of diluLtionrequlirement is suLfficient to meet world water uIse (23), is an expensive opother instream needs as well. An often tion, largely becaulse it is energy-intensive. ulsed diluLtion factor for assessing waste The theoretical minimum energy requlirement to remove salt from water is 2.8 milabsorption capacity is 28.3 liters per second per 1000 population (19). Applying lion jouLlesper cubic meter, but even the best desalination plants now operating ulse 30 timles this amoulnt (24). Technological Table 4. Estimated global water use and conimprovements might reduLceenergy needs sumption, by sector, ca. 1990. to 10 times the theoretical minimLm (24), but this is still a sulbstantialenergy requlireConsmto Use ment. For the foreseeable futLure,desalinaSector (km3/ (km3/ tion is likely to continuLeto be ulsedprimaryear) year) ily to meet drinking wvaterneeds in wateryear) scarce, energy-rich nations. 2880 Agriculture* 1870 The creation of new reservoirs will con975 90 Industry-ltinule to expand AR but at a slower rate. Municipalities-t300 50 an average of 885 large dams WorldwN7ide, Reservoir lossest: 275 275 Subtotal 4430 2285 (those at least 15 m high) were construLcted Instreamflow needs 2350 0 per year between 1950 and the mid-1980s Total 6780 2285 (25). At present, no more than -500 large Total as a percent 54% 18% dams are being completed each year (26, of AR (12,500 km3) 27), and we woulld expect this to drop fulr*Assumes average applied water use of 12,000 m3/ha ther becaulseof rising economic, social, and and consumption equal to -65% of withdrawals. costs (2). We assumnedan enviromnmental :I:Assumesevaporation loss ItEstimatesare fr-om(4). average of 350 new dams per year for the equIalto 5% of gross reservoirstorage capacity. SCIENCE * VOL. 271 * 9 FEBRUARY1996 next 30 years. If average reservoir capacity per dam remains the same as in the period from 1950 to 1985, as well as the proportion that is dead storage or otherwise unavailable for water supply, -1200 km3 would be added to the accessible supply circa (ca.) 2025 (28). Addition of this to existing active storage capacity of 3500 km3 yields a total of 4700 km3 ca. 2025. Combining this with the accessible base flow (9000 kim3) gives an AR ca. 2025 of 13,700 km3/year (29). If average per capita water demand remains the same in 2025 as at present [which is conservative, because withdrawals per capita increased nearly 50% between 1950 and 1990 (2)], global water demand ca. 2025 would total -6400 km3/year. Further, if instream flow needs for pollution dilution increase in direct proportion to population, these would total -3430 km3/yearca. 2025, for a total human appropriation ca. 2025 of -9830 km3/year, or >70% of estimated AR ca. 2025. We ignore the possibility that, during the next few decades, runoff patterns might be altered substantially by temperature increases and precipitation shifts associated with the buildup of greenhouse gases (30). This, in turn, could alter dam requirements and reservoir storage and thus AR. Given the possible nonlinearities in the climatic system, our ca. 2025 AR estimate may be optimistic. The aquatic environment is already showing signs of degradation and decline, particularly because of dam construction, river diversions, heavy pollution loads, and other habitat changes (27, 31 ). Substantially higher levels of human appropriation of AR could result in a severe faltering of aquatic ecosystem services, including broad decimation of fish populations and the extinction of numerous beneficial species. Greater investments in pollution prevention would free up AR to meet rising human water needs while safeguardingecological functions. Likewise, greater efficiency of water use, changes in agricultural cropping patterns, and the removal of marginal lands from irrigation could help slow the growth of huLmanappropriation of AR. REFERENCESAND NOTES 1. A relativelysmall volume of fresh water is transported longer distances by tanker to supply drinkingwater to water-scarce areas. 2. S. Postel, Last Oasis: Facing WaterScarcity (Norton, New York, 1992). 3. P. H. Gleick, Int. Secur. 18, 79 (summer 1993); N. Myers, UltimateSecurity: The Envil-onmentalBasis of Political Stability(Norton, New York, 1993). 4. I. A. Shiklomanov, in Water in Crisis:A Guide to the World's Fresh Water Resources, P. H. Gleick, Ed. (OxfordUniv. Press, New York, 1993), pp. 13-24. 5. P. H. Gleick, Ed., Water in Crisis: A Guide to the World'sFresh WaterResources (OxfordUniv. Press, New York, 1993). 787
