Document 10581449
advertisement
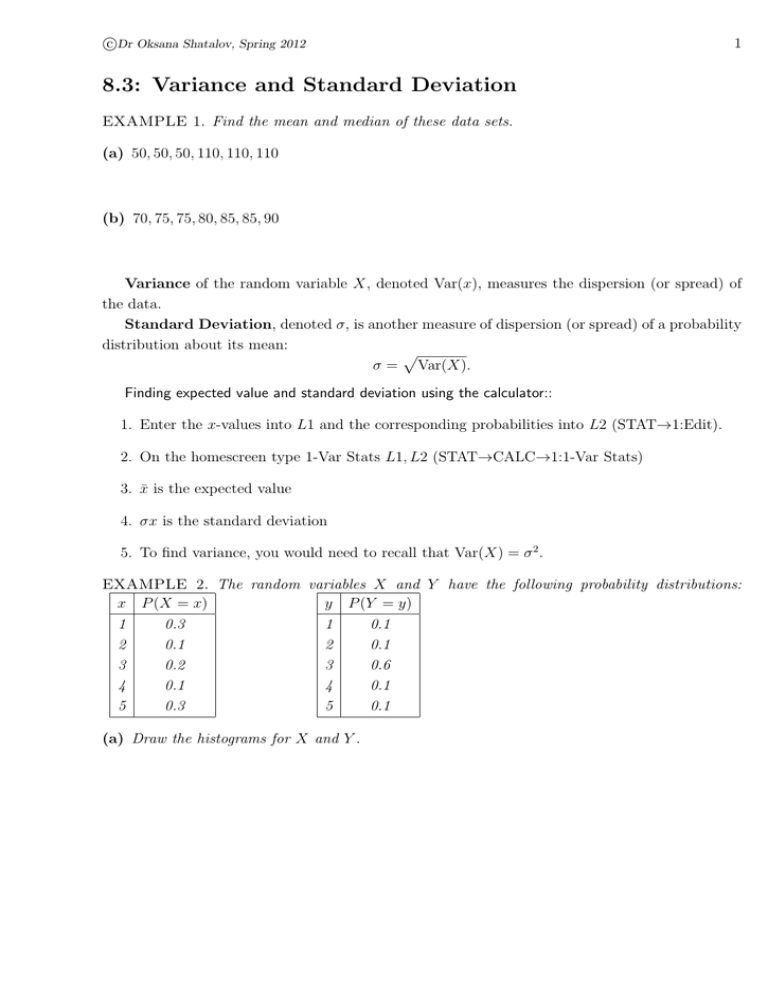
c Dr Oksana Shatalov, Spring 2012 1 8.3: Variance and Standard Deviation EXAMPLE 1. Find the mean and median of these data sets. (a) 50, 50, 50, 110, 110, 110 (b) 70, 75, 75, 80, 85, 85, 90 Variance of the random variable X, denoted Var(x), measures the dispersion (or spread) of the data. Standard Deviation, denoted σ, is another measure of dispersion (or spread) of a probability distribution about its mean: p σ = Var(X). Finding expected value and standard deviation using the calculator:: 1. Enter the x-values into L1 and the corresponding probabilities into L2 (STAT→1:Edit). 2. On the homescreen type 1-Var Stats L1, L2 (STAT→CALC→1:1-Var Stats) 3. x̄ is the expected value 4. σx is the standard deviation 5. To find variance, you would need to recall that Var(X) = σ 2 . EXAMPLE 2. The random variables X and Y have the following probability distributions: x P (X = x) y P (Y = y) 1 0.3 1 0.1 2 0.1 2 0.1 3 0.2 3 0.6 4 0.1 4 0.1 5 0.3 5 0.1 (a) Draw the histograms for X and Y . c Dr Oksana Shatalov, Spring 2012 2 (b) Find the mean, variance and standard deviation of X. (c) Find the mean, variance and standard deviation of Y . EXAMPLE 3. In a class of 100 students, define X as the random variable whose value represents the students grade in Math 141, A = 4, B = 3, etc. Compute the mean, and standard deviation. x freq. of occurrence 4 15 3 29 2 40 1 12 0 4 EXAMPLE 4. Amy is considering investing $5, 000 in 2 mutual funds. The anticipated returns from price appreciation and dividends (in hundred of dollars) are described by the following probability distributions: MUTUAL FUND A MUTUAL FUND B Returns Probability Returns Probability -2 0.25 -2 0.2 4 0.45 3 0.4 5 0.3 4 0.4 (a) Find the mean and variance with the returns for each fund. (b) Which investment would provide Amy with the higher expected return? (c ) In which investment would the element of risk be less?


