APP020 - Amplifier Frequency Response Testing
advertisement
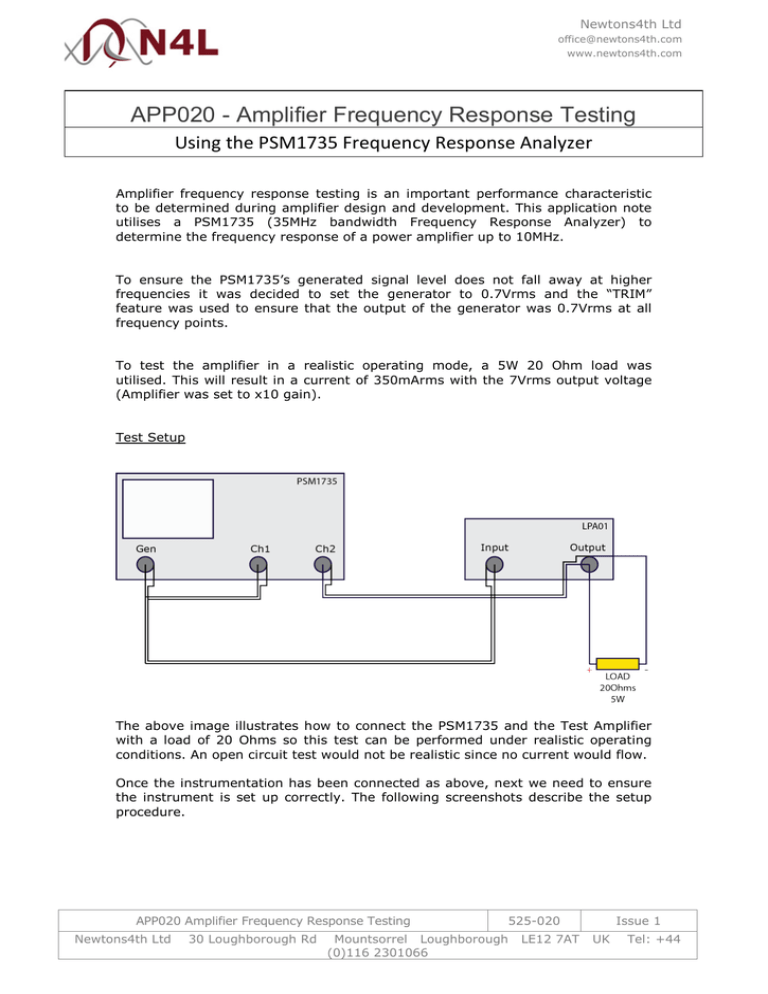
Newtons4th Ltd office@newtons4th.com www.newtons4th.com APP020 - Amplifier Frequency Response Testing Using the PSM1735 Frequency Response Analyzer Amplifier frequency response testing is an important performance characteristic to be determined during amplifier design and development. This application note utilises a PSM1735 (35MHz bandwidth Frequency Response Analyzer) to determine the frequency response of a power amplifier up to 10MHz. To ensure the PSM1735’s generated signal level does not fall away at higher frequencies it was decided to set the generator to 0.7Vrms and the “TRIM” feature was used to ensure that the output of the generator was 0.7Vrms at all frequency points. To test the amplifier in a realistic operating mode, a 5W 20 Ohm load was utilised. This will result in a current of 350mArms with the 7Vrms output voltage (Amplifier was set to x10 gain). Test Setup The above image illustrates how to connect the PSM1735 and the Test Amplifier with a load of 20 Ohms so this test can be performed under realistic operating conditions. An open circuit test would not be realistic since no current would flow. Once the instrumentation has been connected as above, next we need to ensure the instrument is set up correctly. The following screenshots describe the setup procedure. APP020 Amplifier Frequency Response Testing Newtons4th Ltd 30 Loughborough Rd 525-020 Mountsorrel Loughborough (0)116 2301066 LE12 7AT Issue 1 UK Tel: +44 Newtons4th Ltd office@newtons4th.com www.newtons4th.com In the ACQU menu the following settings were made; Speed was set to fast and “Minimum cycles” was set to 6. The instrument will repeat the measurement 6 times in this case and take the average of the 6 results. In the SWEEP menu, the sweep start was set to 1 KHz and the sweep end was set to 10MHz. The instrument will sweep between these two frequencies, from low to high. The step count was set to 500, this represents how many points there are along the X-axis (frequency) of the graph once the results have been plotted. APP020 Amplifier Frequency Response Testing Newtons4th Ltd 30 Loughborough Rd 525-020 Mountsorrel Loughborough (0)116 2301066 LE12 7AT Issue 1 UK Tel: +44 Newtons4th Ltd office@newtons4th.com www.newtons4th.com The trim was set to 700mV on CH1 to ensure that the input signal to the amplifier was maintained at the same level throughout the test. The tolerance was set to 1% to ensure the voltage was within 1% of the specified value. Once the settings had been setup there was a nominal gain of +20dB, this is because the gain was set to x10. By pressing the ZERO button the right hand side of the instrument, the gain of +20 was set to be read as our 0dB reference point. Using PSMComm2 (N4L Bode plotting software) the PSM1735 was remotely controlled and the first sweep at 7Vrms output was performed. A screenshot of PSMComm2 software is shown below; in the screenshot we have plotted two sweeps. One at 7Vrms and another at 2Vrms, this displays the software’s ability to compare numerous plots. APP020 Amplifier Frequency Response Testing Newtons4th Ltd 30 Loughborough Rd 525-020 Mountsorrel Loughborough (0)116 2301066 LE12 7AT Issue 1 UK Tel: +44 Newtons4th Ltd office@newtons4th.com www.newtons4th.com The performance was very flat to the specified bandwidth of the amplifier (1MHz), the 3dB point was at around 3MHz. Throughout the whole frequency response test the output wave form was monitored and remained sinusoidal with little distortion. APP020 Amplifier Frequency Response Testing Newtons4th Ltd 30 Loughborough Rd 525-020 Mountsorrel Loughborough (0)116 2301066 LE12 7AT Issue 1 UK Tel: +44
