Application of Pressure Sensitive Paint (PSP) for Determination of the... and Calculation of Forces and Moments of Models in a...
advertisement
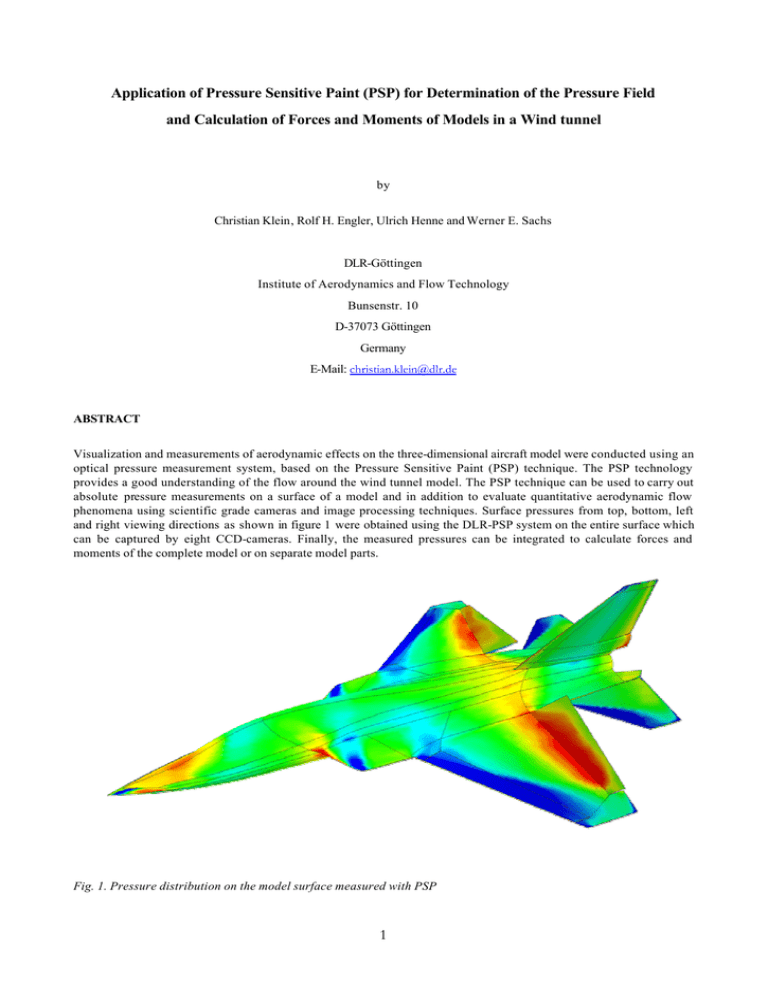
Application of Pressure Sensitive Paint (PSP) for Determination of the Pressure Field and Calculation of Forces and Moments of Models in a Wind tunnel by Christian Klein, Rolf H. Engler, Ulrich Henne and Werner E. Sachs DLR-Göttingen Institute of Aerodynamics and Flow Technology Bunsenstr. 10 D-37073 Göttingen Germany E-Mail: christian.klein@dlr.de ABSTRACT Visualization and measurements of aerodynamic effects on the three-dimensional aircraft model were conducted using an optical pressure measurement system, based on the Pressure Sensitive Paint (PSP) technique. The PSP technology provides a good understanding of the flow around the wind tunnel model. The PSP technique can be used to carry out absolute pressure measurements on a surface of a model and in addition to evaluate quantitative aerodynamic flow phenomena using scientific grade cameras and image processing techniques. Surface pressures from top, bottom, left and right viewing directions as shown in figure 1 were obtained using the DLR-PSP system on the entire surface which can be captured by eight CCD-cameras. Finally, the measured pressures can be integrated to calculate forces and moments of the complete model or on separate model parts. Fig. 1. Pressure distribution on the model surface measured with PSP 1 1. INTRODUCTION For the design of an aircraft with very wide flight envelope, both in speed and angle of attack, it is necessary to establish a very wide data-base for pressure data and aerodynamic loads. This data-base can be measured in wind tunnels by using conventional techniques. Different conventional diagnostic techniques are used in wind tunnel tests depending on the purpose of the investigation and on the nature of the flow, for example PSI- or KULITE technique for pressure data and internal- and external balances for aerodynamic loads. In this context, this paper describes an alternative possibility to get this data-base for an aircraft by using Pressure Sensitive Paint (PSP). Non-intrusive pressure measurements using PSP play more and more an important role in aerodynamics. Various paints as single-colour and two-colour versions exist including different hard- and software. Up to now the best results have been obtained with PSP in transonic speed ranges because of the high absolute pressure differences. The main challenge to get acceptable PSP results on one hand is the arrangement of hardware, components of model illumination and camera observation - especially in the handling of eight simultaneously operating CCD cameras. On the other hand the software should be able to handle in a short time all the necessary synchronization between PSP-system and wind tunnel, all PSP images, correction of lens errors, model deformation etc.. The following paragraphs describe how these problems can be solved. A large number of results were mainly obtained on the EADS MAKO aircraft model in the DNW-HST at Amsterdam. 2. EXPERIMENTAL METHOD 2.1 PSP Basis The PSP measurement procedure is based on the photo chemically deactivation of excited molecules, i.e. luminophores by oxygen molecules. By means of a special technique and application of suitable optical systems, static pressure values can be measured on the surface of the model in the test facility (wind tunnel) and the flow phenomena can be assessed quantitatively. However, the precise determination of pressure requires a measurement system with the high local resolution capability, required in the transonic velocity range. When luminophores absorb emitted light, they are excited from the base energy state to a higher energy state. These molecules can lose the high energy level either through emission of light (luminescence) or even without radiation. The interaction of excited Iuminophores with oxygen molecules increases the possibility of a radiation-free process. Possible energy levels (electron level, vibration level and rotation level) of molecules are quantized. Under normal conditions, almost all molecules are found to have "strongly prohibited" transitions. The probability of transition between different energy levels of molecules is determined by the electronic structure of the initial and the final states. The absorption of light and thus the excitation of a molecule M having the basic energy status So and presently being at a higher energy level S1 can be described as: Photon absorption (Ia) MS0 + hν → MS1 (1) Luminescence (k fl) MS1→ MS0 + hνfl (2) Nonradiative decay (k nr ) MS1→ MS0 + ∆ (3) Quenching (k q ) MS1 + O2 = MS0 + O*2 (4) The presence of a quencher in the system results in a more rapid depletion of the excited-state population, which is detected as either a concomitant decrease in steady-state luminescence intensity or as a shorter emission decay time. Changes in either intensity or decay time can be used to quantise the amount of analyte present. These schemes lead to the Stern-Volmer (SV) expressions, quantitatively relating lifetime and luminescence intensity to quencher concentration, which becomes the basis for the intensity method for non time resolved measurements as: I ( p= 0) I = 1 + k SV ⋅ p (5) where I(p=0) - intensity for vacuum conditions, k SV - Stern-Volmer constant and for the lifetime method as: 2 τ ( p =0 ) τ = 1 + k SV ⋅ p (6) where τ (p=0) - lifetime for vacuum conditions, k SV - Stern-Volmer constant in which k SV can be expressed as k SV= k q τ(p=0) = k q ( k r + k nr ) -1 (7) An ideal sensor based on Stern-Volmer kinetics requires minimal calibration because the response to the quencher concentration is linear. Although static quenching, inhomogeneous systems and short lifetimes can pose significant barriers, numerous sensors are based on this scheme. 2.2 Design of different pressure sensors Principally, as mentioned earlier, the optical pressure sensor must be quenchable with oxygen for the application in test facilities like wind tunnels and at the same time enable the measurement of partial pressure of oxygen. Therefore, it is clear that such a sensor must consist of two parts, namely, a binder which is permeable for the diffusion of oxygen and a luminophore for quenching. The diffusion of oxygen is a time-dependent process, which is affected significantly by the thickness l of the polymer layer. This can be described for polymer binders as follows: t relaxation = 4⋅l2 π2⋅D (8) where D is the oxygen coefficient of the binder, i.e., the polymer layer. The permeability of the binder should not be too high to ensure that all the excited luminophores are not quenched by oxygen. Besides, it must be ensured that the luminophores can be quenched by the oxygen diffused through the binder within their lifetime τ, otherwise, no pressuredependent intensity variation can be observed. It gives then an optimum characteristic of the optical sensor for the different cases of application with reference to the maximum pressure changes to be expected (transonic range 0.3 to 1.5 bar, low speed range 0.7 to 1.1 bar) both for the selection of the binder as well as for the number of luminophores in the binder. In order to achieve highest possible detectable intensity, the number of the luminophores should be high. They should not react with each other, otherwise, it can lead to irreversible processes. In addition, the sensor must withstand the normal and tangential aerodynamic forces; it must be as far as possible thin, flat and smooth and have uniform characteristics over the entire surface of the model. For obtaining a smooth optical sensor on the entire surface, a spray gun is usually employed; mono layer technology to obtain a uniform pressure sensor is under development. O UV-light 2 phosphorescence (10 - 4 - 1 s) luminescence fluorescence (10 20 - 40 µ -9 - 10 -5 active layer (Polymer) 2µ contact layer 20 µ screen layer model surface Fig. 2. The different layers for coating the model surface with "binary paint" 3 s) The paint sensor typically consists of three polymeric layers, which are applied consecutively to the model surface as shown in figure 2. They are: • Screen layer • Contact layer • Active layer with different luminophores The screen layer is composed of a special white paint which creates an optical uniformity on the model surface, which is independent of the model material and it also increases the reflection of light. The contact layer is applied to ensure adhesion between the screen layer and the active layer. The active layer consists mainly of three components: a polymer layer highly permeable to oxygen (binder), a pressure sensitive luminescent luminophore dispersed within the polymer and finally, intensity sensitive luminophores (which are sensitive only to illumination intensity and insensitive to pressure and temperature) for intensity correction of the non homogeneous distribution of illumination. 2.3 Characteristics and calibration of the pressure sensors Both in medicine as well as biology, a large number of molecules exist which can be used as oxygen sensors. For the use as a luminophore, i.e., molecules with sufficiently long lifetime for quenching with oxygen, platinum (PtOEP)- and ruthenium-complexes such as tris -2,2'bipyridyl-ruthenium(ll) can be employed. For excitation of luminophores, the blue line (λ= 488 nm) of an argon-ion laser can be used. Pyrene belonging to a group of aromatic hydrocarbons is well known as a luminophore in optical sensors. The absorption spectrum of pyrene i.e., UV light of the wavelength (λ) 337±10 nm from a Xenon flash lamp can be used for the excitation of luminophores. The characteristics of pyrene and ruthenium as luminophores with respect to their sensitivity to pressure become clear from their calibration curves shown in figure 3. 1.0 I/I0 Pyrene 0.8 A= 0.64 Stern-Volmerrelation 0.6 I0 = A⋅ p + B I Ruthenium A= 0.91 0.4 0 200 400 600 800 p [mbar] Fig. 3. Typical calibration curves for two different types of luminophores at T=20° From the calibration curves it is clear that pyrene has a more linear behaviour than ruthenium. The pressure sensitivity of ruthenium based paints appears to be larger than pyrene based paints; so is the error due to the temperature effects, 0.2%/ °C for pyrene compared to 1.6%/°C for ruthenium. The lifetime of ruthenium is of the order of 1-2 µs whereas for pyrene it is about 50-100ns and therefore, it is a more suitable paint for investigation of fast processes. A calibration of the optical pressure sensor is necessary for reconstructing a quantitative pressure image from the initial qualitative image of the flow phenomenon on the surface of the model. This can be done mainly in two different ways. In the first one, a test specimen is calibrated parallel to the model paint and subsequently, subjected to known pressure and temperature in an external calibrating chamber. In the other case, the entire model can be calibrated in the wind tunnel itself, provided pressure changes can be statically produced at constant temperature in the test section. In the external 4 calibration chamber the pressure and the temperature can be varied and consequently the described temperaturedependent calibration constants can be determined and related to pressure reconstruction. The temperature of the model surface necessary for correcting the pressure computations must be either measured during the experiment or calculated later using recovery temperatures. As already mentioned, this is much more easier with pyrene based paint than ruthenium based paint. The disadvantage of an external calibration procedure consists in the fact that the test specimen can indeed be painted simultaneously with that of the model, but definitely will not possess identical optical properties as that of the model, typically due to possible differences in the thickness of the layer. Therefore, if possible, the direct calibration of the model is always preferable, since automatically the peculiarities of the model geometry and the layer thickness are taken into account. In addition, for every angle attack of the model a separate calibration data set can be calculated. Besides, there is the advantage that a separate calibration data set is available for each pixel of the recorded image of the wind tunnel model and therefore, a higher resolution of pressure is possible. 3. EXPERIMENTAL SETUP 3.1 PSP formulation DLR02 DLR develops in cooperation with the Organic-Institute of University Göttingen (Hohenheim) pyrene-based PSPs. The DLR02 formulation contains a pyrene derivate as pressure sensitive dye and a Europium complex as reference dye. The two components of the paint absorb the ultraviolet excitation and emit at different wavelengths. Figure 4 displays the emission spectrum of the paint DLR02 when excited at 337nm. Fig. 4. Emission Spectra of the binary pyrene-based paint DLR02 The resulting pressure sensitivities for three different temperatures are presented in figure 5 for the DLR02 formulation. An intensity change of 0.1% with the paint DLR02 gives a pressure change of 0.8mbar. This quite high pressure sensitivity decreases the effect of the error sources like noises induced by the camera. The temperature sensitivity of the DLR02 paint can be given with 3-5mbar/°C. So, the DLR02 formulation displays very good characteristics: small temperature sensitivity and insensitivity to excitation variations and finally the paint DLR02 does not show degradation of the pressure sensitive component occurring under flow conditions. 5 Fig. 5. Stern-Volmer calibration curve of the binary pyrene based paint DLR02 3.2 PSP hardware for data acquisition For each observation direction one UV light source was used and each was connected to four fibre optics of 20m length. Therefore, in total, 16 fibre optics illuminated the complete model from all the four directions, see figure 6. Eight cooled CCD cameras with 12-bit resolution were used for image acquisition. In this arrangement, exposure times of about 10s for a typical distance of 1.0m between the cameras and the model could be realized. A two camera system for pressure and reference images was used to obtain the necessary signals. The filters employed separate the emitted light as follows: one at 450-550nm for the pressure signal itself (called “blue”); and one at 600-650nm for the reference component (called “red”). So pair of images was acquired in parallel by using the twin CCD-camera system from each viewing direction. Fig. 6: PSP setup for 360° PSP measurements incl. local net system for data evaluation 6 3.3 PSP software for data acquisition, data reduction and system control As PSP becomes a standard wind tunnel measurement system, the automated acquisition of data also becomes more and more important. Firstly an automatically data exchange system was used to integrate the DLR-PSP-system completely into the wind tunnel data acquisition system. The DLR software “ToPas” (Three dimensional optical Pressures analyse system) is handling the automatic data acquisition. This method is time and error reducing and therefore very useful for industrial wind tunnel tests. In addition ToPas is used for the data reduction of the acquired images to 3D results using the following steps: - PSP calibration in an external chamber (“a-priori” calibration). - 3D image alignment (resection). - Conversion of the intensity data on the 3D grid into pressure data by applying the calibration law. - Data extraction (PSP/PSI comparison, forces and moments). - Export 3D results data for the customer. An extensive description of the software is beyond the scope of this paper. One important feature for industrial tests is that the data reduction is completely automated and the 3D results for the whole model are delivered only a few minutes after test. 3.4 Model and wind tunnel The presented measurements were performed in the Transonic Wind Tunnel of DNW-HST in Amsterdam. This wind tunnel is a continuously driven facility that operates at Mach numbers between 0.5 and 1.1 having a 1.8m x 1.8m test section with slotted walls. In figure 7 the geometry of the investigated EADS-MAKO model is shown. This model has a length of 1.2m and a span of 1.0m and is equipped with some conventional pressure taps (PSI-technique) which are used for PSP and PSI comparison. Calibration measurements could be performed in the test section itself, because the wind tunnel can be pressurized from 0.3 to 1.5 bar. A total of 19 model configurations with different flaps rudders etc. were tested. Besides the basic model about 50 additional model parts have been coated with DLR02 paint. In addition the model is equipped with an internal six-component balance and an internal balance for the hinge moments of the horizontal tail. Fig. 7. Model in the test section of the DNW-HST wind tunnel 7 4. RESULTS AND DISCUSSION A typical PSP result for the investigated model is given in figure 8. The two dimensional PSP images have been mapped to the three dimensional CFD grid of the model, using DLRs ToPas software. All the different view information of the 8 installed cameras must be merged excluding overlapping regions of the different viewing directions. The color bar gives the relationship between the shown color on the model surface and the calculated pressure values based on the intensity values measured with PSP. The pressure distribution in figure 8 shows clearly the vortex trajectories as “footprints”. Vortex interactions can therefore be easily visualized already only few minutes after taking the raw images by making several measurements for different angles-of-attack and Mach numbers. low high Pressure Fig. 8. Pressure distribution on the model surface Fig. 9. Normal force of the complete MAKO model 8 The comparison of the measured pressure coefficients with the PSP technique and the conventional pressure tap technique (PSI) shows a good agreement. In average on each grid point of the model a standard deviation of ∆Cp<= 0.05 was achieved. The final data format (TecPlot) is compatible with numerical results. In addition to the PSP investigations balance measurements of the complete model and of the left horizontal tail were performed. In figure 9 the comparison of PSP integrated pressures and the internal balance for the normal force are given. For the normal force the PSP technique is in good comparison with the balance data. In figure 10 comparisons of the hinge moment balance data and the PSP results for the bending moment are shown. Since the PSP data are available all over the models surface also the bending moment for the right horizontal tail can be calculated and compared. Finally an accuracy of single loads between balances and PSP measurements of ~5% in difference could be obtained. Fig. 10. Bending moment of the horizontal tail 5. CONCLUSIONS The PSP technique is an excellent tool to visualize aerodynamic phenomena on a complex three-dimensional model in nearly real-time and to optimize its aerodynamic characteristics. Vortex interactions, like merging and breakdown, can be clearly analyzed using this two dimensional technique. Even fine structures, such as instabilities in the vortex-sheer layer, and secondary-vortex structures with their influence on the pressure at the model surface, can be detected and interpreted using the described optical pressure measurement system. In addition forces and moments can be calculated using the PSP measured pressure field over the complete model surface. ACKNOWLEDGEMENTS We would like to thank EADS (München, MT 634) and DNW (Amsterdam, HST) for their support. The authors would like to thank in particular Gerhard Wolfrum, Wolfgang Schwarz from EA DS and Leo de Haij from DNW-HST for interesting discussions, ideas and assistances . 9 REFERENCES Volan, A. & Alati, L. 1991, “New Optical Pressure Measurement System” 14th ICIASF Congress, Rockville, MD. USA, pp.10-16. Engler, R.H., Hartmann, K., Schulze, B. 1991, “Aerodynamic assessment of an optical pressure measurement system (OPMS) by comparison with conventional pressure measurements in a high speed wind tunnel”, 14th ICIASF Congress, Rockville, MD. USA, pp.17-24 Troyanovsky I., Sadovskii N., Kuzmin M., Mosharov V., Orlov A., Radchenko V., Phonov S., 1993, “Set of luminescence pressure sensors for aerospace research”, Sensors and Actuators B, 11 201-206 Morris, M.J., Donovan, J.K. Kegelmann, J.T., Schwab, S.D., Levy, R.L. & Crites, R.C. 1993, “Aerodynamic Applications of Pressure Sensitive Paint”, AIAA Journal, Vol. 31, No.3, pp. 419-425. Bell J.H., McLachlan B.G., 1993, “Image Registration for Luminescent Paint Sensors”, 31st Aerospace Sciences Meeting & Exhibit, Paper AIAA 93-0178 McLachlan, B.G., Kavandi, J.L., Callis, J.B., Gouterman, M., Green, E. & Khalil, G. (1993). “Surface Pressure Field Mapping Using Luminescent Coatings”, Experiments in Fluids 14, pp.33-41. Engler R.H. 1995, “Further Developments of Pressure Sensitive Paint for Non Flat Models in Steady Transonic Flow and Unsteady Conditions”, 16th ICIASF Congress, Dayton, Ohio, USA, pp.123-133. Klein Chr, 1997, “Einsatz einer druckempfindlichen Beschichtung (PSP) zur Bestimmung des momentanen Druckfeldes von Modellen im Windkanal, Dissertation University Göttingen, Germany, DLR-Forschungsbericht 97-55, ISSN 1434-8454 Engler R.H., Klein C., 1997, “First Results Using the New DLR PSP System - Intensity and Lifetime Measurements”, Wind Tunnels and Wind Tunnel Test Techniques, 14-16 April 1997, Cambridge, UK, Paper 43 Ruyten W, Fisher C., 2000, "On the Effects of Reflected Light in Luminescent Paint Measurements", 38th Aerospace Sciences Meeting and Exhibit, AIAA2000-0833, January 2000. Sellers M.E., 2000, “Application of Pressure Sensitive Paint for Determining Aerodynamic Loads on a Scale of the F16C”, 21st AIAA Aerodynamic Measurement Technology and Ground Testing Conference, Paper AIAA 2000-2528, June 2000. 10 11
