Simultaneous PIV- and pressure measurements upstream and downstream of a fence
advertisement
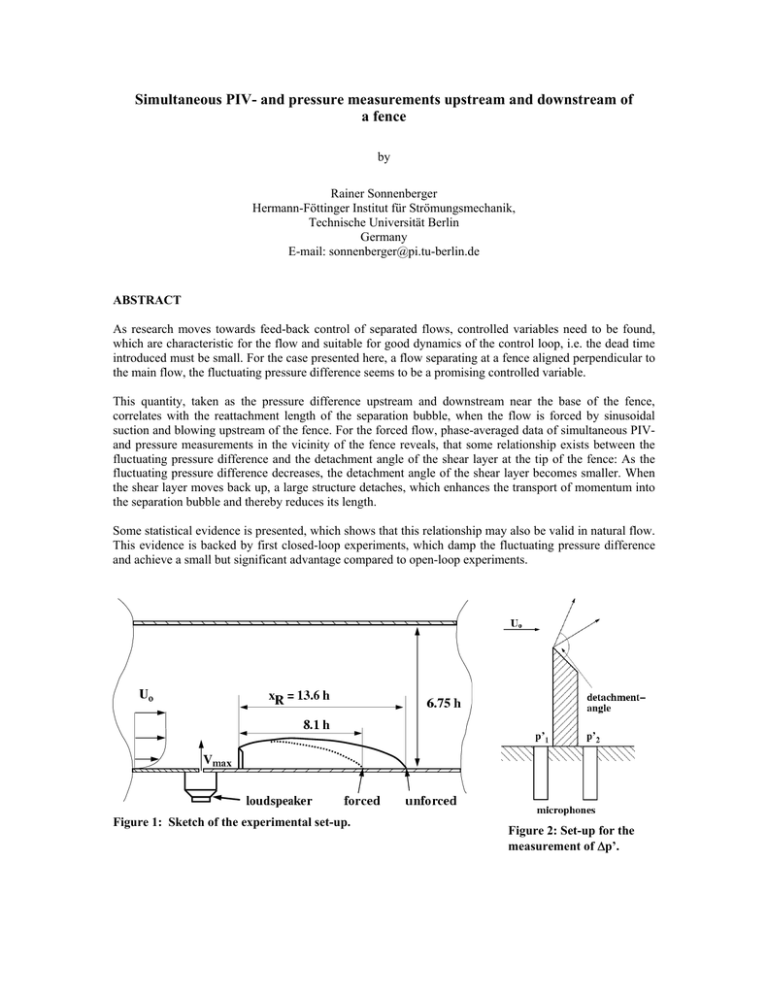
Simultaneous PIV- and pressure measurements upstream and downstream of a fence by Rainer Sonnenberger Hermann-Föttinger Institut für Strömungsmechanik, Technische Universität Berlin Germany E-mail: sonnenberger@pi.tu-berlin.de ABSTRACT As research moves towards feed-back control of separated flows, controlled variables need to be found, which are characteristic for the flow and suitable for good dynamics of the control loop, i.e. the dead time introduced must be small. For the case presented here, a flow separating at a fence aligned perpendicular to the main flow, the fluctuating pressure difference seems to be a promising controlled variable. This quantity, taken as the pressure difference upstream and downstream near the base of the fence, correlates with the reattachment length of the separation bubble, when the flow is forced by sinusoidal suction and blowing upstream of the fence. For the forced flow, phase-averaged data of simultaneous PIVand pressure measurements in the vicinity of the fence reveals, that some relationship exists between the fluctuating pressure difference and the detachment angle of the shear layer at the tip of the fence: As the fluctuating pressure difference decreases, the detachment angle of the shear layer becomes smaller. When the shear layer moves back up, a large structure detaches, which enhances the transport of momentum into the separation bubble and thereby reduces its length. Some statistical evidence is presented, which shows that this relationship may also be valid in natural flow. This evidence is backed by first closed-loop experiments, which damp the fluctuating pressure difference and achieve a small but significant advantage compared to open-loop experiments. Figure 1: Sketch of the experimental set-up. Figure 2: Set-up for the measurement of ∆p’. 1 INTRODUCTION Flow separation occurs in many technical applications encurring disadvantages, such as a decrease of lift, an increase of drag and noise. Therefore, manipulation of separated flows is desirable and considerable effort has been made to control separated flows by passive or active means. Passive separation control alters the flow without additional energy input (vortex generators, grids), whereas active separation control (vortex-generator jets, moving spoilers, suction and blowing) needs external energy input. In the past, the research on active separation control has focused on open-loop methods: First, an excitation signal is fed into to the flow, then, the efficiency of the applied signal is evaluated by some characteristic quantity, such as the reattachment length, the drag, the lift or the increase of the skin friction. At very efficient forcing frequencies, flow instabilities, such as the ‘vortex- shedding type’ instability (Sigurdson, 1995) can be identified. Recently, attempts were made to apply closed-loop methods to active separation control (Allan et. al., 2000, Becker et. al. 2002): The information about the drag or the reattachment length are fed-back into a controler in order to adjust the magnitude of the excitation. These control quantities, however, are determined by time averages and induce a delay (dead time), which slows down the dynamics of the feedback loop. Thus, the controler cannot react to large scale fluctuations in the flow. Here, transition control is much more advanced, where – among other researchers - Thomas (1983) manged to damp out artificially generated fluctuations and Baumann (1999) succeeded to suppress natural fluctuations. Furthermore, some of the characteristic quantities used in open-loop control are not suited for closed-loop control, even if time signals were available. If an actuator introduces some excitation near the point of flow separation, the response in the reattachment region is delayed by a time intervall, which scales with the convection velocity and the length of the separation region. This dead time reduces the dynamics of the controler even further. Therefore, the reattachment length is not a suitable control quantity. The pressure difference up- and downstream of an obstacle appears to be a much better quantity for feedback control because it contains information on the detaching flow, the separation region and on the reattachment length. By means of simultaneous PIV- and pressure measurements, this study investigates the relationship between the pressure difference and the flow in the near field of the obstacle in order to asses, whether the pressure difference is a suitable quantity for closed-loop separation control. 2 EXPERIMENTAL SET-UP The experimental set-up to be presented has been designed and studied by Siller&Fernholz (1998) and Siller (1999). Schmidt (1997) performed similar investigations at lower Reynolds numbers: The flow over a fence ambedded in a turbulent boundary layer (figure 1) was investigated in a wind-tunnel with a test-section of 1.5 m in length and 440 x 135 mm cross-section. The boundary layer formed on the floor of the nozzle is blown out at the inlet to the test-section. The flow is tripped by means of Velcro tape just downstream of the leading edge in the test section. A fence is mounted perpendicular to the main flow 638 mm downstream of the leading edge. Upstream and downstream of the fence (height h=20mm), two separation regions exist: The unforced (natural) flow separates at 0.65 h upstream of the fence and reattaches 13.6 h downstream of the fence. The cross-flow velocity was U0 = 8 m/s and the fence Reynoldsnumber Reh = 10500. For the forced flow, a sinusoidal signal was fed to a loudspeaker, which communicates with the flow via a slit of 1 mm in width, aligned perpendicular to the main flow. The slit, positioned 1.75 h upstream of the fence, produces periodic suction and blowing perpendicular to the main flow and injects vortices into flow. Thus reducing the length of the separation region downstream of the fence. In order to asses the intensity of the flow excitation, the sound-pressure level was measured in the chamber just below the slit: At 136 dB and 21 Hz the velocity amplitude at the slit was vmax =16 m/s and a maximum reduction of the reattachment length XR of 40% was obtained. For the experiments discussed in this paper, the sound pressure level was 130 dB (vmax =8 m/s). The reattachment length was shortened by 25 % compared to the unforced flow. Figure 2 depicts the set up near the fence: Two Bruel & Kjaer 1/4'' condenser microphones are positioned at midspan upstream and downstream of the fence. The pressure-signals as well as the trigger-signal of the PIV-exposures are recorded by a computer. Then, the pressure difference ∆p’=p’2-p’1 is taken for further evaluation. Due to the small distance between the microphones (12.5 mm) the acoustic parts of the pressure signals are almost identical at low frequencies. By calculating the pressure difference, the acoustic part, such as the blade passing frequency, is elmininated and ∆p’ contains a pressure signal, which originates from flow structures only. The flow field above the microphones and in the vicinity of the fence was investigated by means of PIV. The measurement plane was at midspan, aligned perpendicular to the fence. The flow was seeded with DEHS tracer-particles with a maximum diameter of 1 µm. The DPIV-equipment consisted of standard commercial equipment: a Continuum-made laser (Minilight, 25mJ/pulse), a digital double shutter camera (PCO-Sensicam) and PIV-software (ILA, former Optical Flow Systems). The trigger signal, generated by an HP-made Arbitrary Waveform Generator, was shifted in phase from exposure to exposure, in order to record the flow at 64 different phase angles relative to the excitation frequency. Six images were taken at each phase angle, which is a small number if phase averaging is applied. However, since only the first 10 harmonics of the exciation frequency are of physical relevance, the higher harmonics can be filtered out, which yields fairly smooth results (see Sonnenberger, 2001). Due to filtering we reduced the number of exposures by a factor of 6 to 10. Phase averaging was applied to the pressure signals. Then, phase-averaged pressure signals and PIVexposures were matched via the trigger signals. 3 RESULTS Initially, the relationship between the reduction of the reattchment length and the signal of the fluctuating pressure at the fence were investigated, in order to choose suitable test cases for detailed PIV-studies. The result of this first experiment is shown in fig. 3: The excitation level is kept constant at pref = 130 dB (vmax = 8 m/s) and the excitation frequency, fe is varied. The optimum is obtained at an excitation frequency of 21 Hz (Sth = 0.05), where the the reattachment length is reduced by 25 % compared to the unforced flow (black curve). The excitation becomes less efficient with growing frequencies until a minimum is reached at 60 Hz (Sth==0.14 to 0.15). For higher excitation frequencies, the reattachment length is reduced further, but it does not exceed minimum found at 21 Hz. Interestingly, the RMS-value of the fluctuating pressure difference ∆p’ (blue curve) shows the same behaviour, whereas the RMS-values of the pressure signals up- and downstream (green and red curves) do not correlate with the reduction of the recirculation length. Thus we have found evidence that a signal is available at the fence, which contains information on the reattachment length further downstream. For further studies, test cases were chosen at excitation frequencies of 21 and 60 Hz. Figure 3: Relationship between the reduction of the reattachment length and the fluctuating pressure at the fence over the excitation frequency. Figure 4: Phase-averaged fluctuating pressure difference ∆p’ and flow fields at selected phase-angles (excitation frequency: 21 Hz). The vorticity range is from –7 000s (dark red) to 1000/s (light blue). For the case fe= 21 Hz the phase-averaged fluctuating pressure difference is shown in figure 4-a. Most of the time, this quantity changes only slightly, and the detachment angle of the shear layer at the tip of the fence, figure 4-b, is about 45°. Due to the excitation a vortex is injected into the flow, which convects towards the fence, figure 4-c. The fluctuating pressure difference reaches a sudden minimum as the vortex approaches the fence and the shear-layer detaches almost horizontally from the fence. Now, a vortex forms downstream of the fence, figure 4-d, while the fluctuating pressure difference returns to positive values and the shear layer flaps back into its 45°. equilibrium position. The detachment-angle of the shear layer and the fluctuating pressure difference are related in that as the fluctuating pressure-difference decreases, the detachment angle decreases and vice versa. The vortex downstream of the fence is increases the transport of momentum from the potential flow into the separation bubble, which then decreases in size. However, there is another effect which may not be negligible: By means of a microphone-array, consisting of 14 electrets, the fluctuating wall pressure was measured further downstream. The signals are filtered by a 2-D Fourier filter in time and space (flowdirection), in order to discard all waves oriented orthogonal to the time-axes because they contain the acoustic parts of the signal. Fig. 5 shows some of these signals at positions near reattachment. As the vortex passes the electret positions, the pressure reaches a minimum, as one would expect from potential theory (vortex in parallel flow). However, after the passage of the vortex, the first three curves (blue, green, red), reach an absolute maximum which slowly decays until the next vortex approaches. It must be concluded, that the fluctuating pressure upstream of the vortex is higher than downstream, i.e. the vortex ‘transports’ a negative pressure gradient which becomes smaller as the vortex moves downstream. Near reattachment (black curve) the maximum pressure is found before the pressure minimum is reached, i.e. the pressure gradient has changed its sign. These pressure gradients might cause additional excitation in the shear layer and enhance the transport of momentum even further. Figure 5: Phase-averaged pressure-traces in the separation bubble near reattachment (XR=10.2 h). Fig. 6 depicts the second test case at fe= 60 Hz. Vorticity-scaling and selected phase angles are identical with fig. 4, so both figures can be directly compared with each other. The fluctuating pressure difference in fig.6-a is of sinusoidal shape without any sharp minimum and the magnitude of the signal is about 4 to 5 times smaller than in the former test case. Similarly, the vortex produced by the excitation source is much smaller in size and vorticity (fig6-b). It vanishes as it approaches the fence (fig 6-c) without producing any measureable effect on the detachment angle of the shear layer. Even though this result is negative, the two test cases show, that with growing fluctuations of ∆p’ the fluctuations of the detachment angle of the shear layer also grow. Figure 6: Phase-averaged fluctuating pressure difference ∆p’ and flow fields at selected phase-angles (excitation frequency: 60 Hz). The vorticity range is from –7 000/s (dark red) to 1000/s (light blue). Is there any evidence, that the relationship between ∆p’ and the detachment angle of the shear layer also exists in the natural flow? Since phase-averaging cannot be used to answer this question, we assume a proportional relationship between ∆p’ and the fluctuations of the vorticity ω’(x,y): ω’(x,y)= C(x,y) * ∆p’. C(x,y), the gain for each point in the flow field, is calculated by linear stochastic estimation and depicted in figure 7 (right). For the interpretation of the figure, please consider the following: Figure 7 (left) shows the averaged vorticity and thus the equilibrium position of the shear layer. Now consider the points just below the shear layer, where the averaged vorticity is about zero: If ∆p’ drops to strongly negative values, we expect to see a smaller detachment angle (figure 4) and the shear layer moves downwards. Thus, the points under consideration experience a strong negativ vorticity fluctuation and the constant C in the above model should be positive, which agrees with the data of figure 4 (right). The inverse applies to points just above the equilibrium position of the shear-layer: As ∆p’ becomes strongly positive, the shear layer is expected to rise and ω’(x,y) at these points becomes strongly negative. So the constant C in the above model becomes negative, which corresponds with the results in figure 4 (right). The data in figure 4 (right) is very noisy, and there are other sources of vorticity fluctuations, which are indendent of ∆p’, such as small scale structures in the turbulent boundary layer or the limited resolution of the PIV measurement technique. Therefore, it is difficult to say, whether the feed-back control of the fluctuating pressure-difference will have a global effect on the separation bubble itself. Figure 7: Investigation of the shear layer near the tip of the fence in natural (unforced) flow. Mean vorticity (left), gain C of the relationship ω’= C*p’ (right). First feed-back experiments with a modified excitation source (suction and blowing at the tip of the fence), point in the right dircetion though: If ∆p’ is feed-back controlled by a SISO-(single input, single output) system, some portions of the power spectrum can be damped (figure 8). By damping we expect to reduce the structures in the shear-layer, which is important for noise reduction in separation bubbles (Fehse & Neise, 2000). Thus the transport of momentum decreases and the separation bubble should become longer. So far, we do not see an increase of the reattachment length, but we found a significant difference between feed-back and feed-forward control: In the first run of the experiment, ∆p’ is damped by feed-back control and the input signal into the excitation source is recorded. The reduction of the recirculation length is about 9 %. Then, in a second run, the recorded signal is fed-forward into the excitation source, which results in a 13% reduction of the recirculation length. Thus, we may say that the feed-back of ∆p’ enhances the performance of the flow control, but the results are not yet as good as they ought to be. 4 Future Work Currently a MIMO (multiple input/multiple output) controller is being designed, which expands the feedback control in spanwise direction and will hopefully yield better global control results. 5 Acknowledgements The author would like to thank Mark Pastoor and Lars Henning for the huge amount of work, which they put into this project. Thanks also to the DFG for funding. Figure 8: Power spectrum of the fluctuating pressure difference in natural flow and feed-back controlled flow. REFERENCES Allan, B., Juang, J., Raney, D., Seifert, A., Pak, G. & Brown, D., 2000 , Closed-loop separation control using oscillatory flow excitation, ICASE Report No. 2000-32 Baumann, M., 1999, Aktive Dämpfung von Tollmien-Schlichting Wellen in einer Flügelgrenzschicht, Doctoral Thesis, TU-Berlin Becker, R., Garwon, M., Gutknecht, C. Bärwolff, G. & King, R., 2002, Regelung aerodynamischer Strömungen am Beispiel einer rückwärtsgewandten Stufe, at-Automatisierungstechnik,50 (2),79-86 Fehse, K.-R. & Neise, W., 2000, Low frequency sound generated by flow separation in a conical diffusor, Eur. J. Mech. B-Fluids, 19, 637-652 Orellano, A. & Wengle H., Numerical simulation (DNS and LES) of manipulated turbulent boundary layer flow over a surface-mounted fence, Eur. J. Mech. B-Fluids, 19, 765-788 Schmidt, J., 1997, Experimental and numerical investigation of separated flows, PHD-thesis, Technical University of Denmark Siller, H. & Fernholz, H.H. 1998. A fence flow with cross-flow forcing. In 9th International Symposium on Applications of Laser Techniques to Fluid Mechanics, Lisbon, Portugal, book of abstracts, 20.5.1 20.5.8. Siller, H., 1999, Reduction of the recirculation length downstream of a fence by an oscillatory cross-flow, Doctoral Thesis, TU-Berlin, Mensch & Buch Verlag Sigurdson, L.W., 1995. The structure and control of a turbulent reattaching flow, J. Fluid Mech, 298, 139165 Sonnenberger, R., Graichen, K. & Erk, Pl, 2000, Fourier-averaging: a phase-averaging method for periodic flow. Experiments in Fluids, 28, 217-224 Thomas, A.S.W., 1983, The control of boundary-layer transition using a wave superposition principle, J. Fluid Mech, 137, 233-250
