Combined Measuring Technique of Sound and Flow Fieldfor Evaluation of... Noise
advertisement
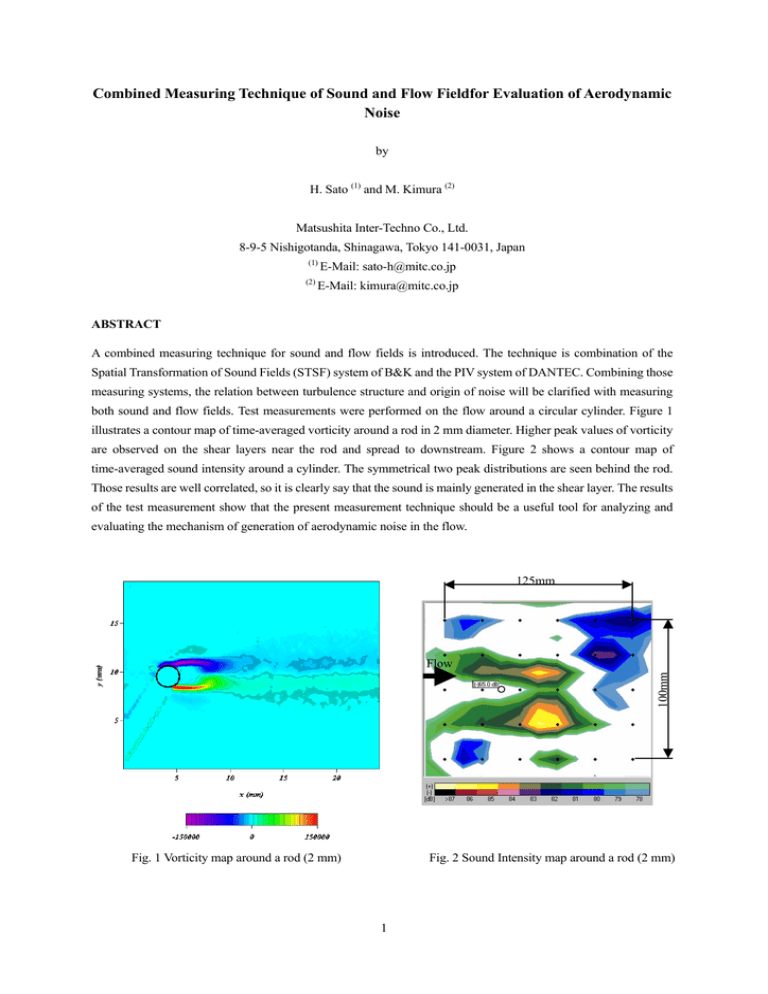
Combined Measuring Technique of Sound and Flow Fieldfor Evaluation of Aerodynamic Noise by H. Sato (1) and M. Kimura (2) Matsushita Inter-Techno Co., Ltd. 8-9-5 Nishigotanda, Shinagawa, Tokyo 141-0031, Japan (1) (2) E-Mail: sato-h@mitc.co.jp E-Mail: kimura@mitc.co.jp ABSTRACT A combined measuring technique for sound and flow fields is introduced. The technique is combination of the Spatial Transformation of Sound Fields (STSF) system of B&K and the PIV system of DANTEC. Combining those measuring systems, the relation between turbulence structure and origin of noise will be clarified with measuring both sound and flow fields. Test measurements were performed on the flow around a circular cylinder. Figure 1 illustrates a contour map of time-averaged vorticity around a rod in 2 mm diameter. Higher peak values of vorticity are observed on the shear layers near the rod and spread to downstream. Figure 2 shows a contour map of time-averaged sound intensity around a cylinder. The symmetrical two peak distributions are seen behind the rod. Those results are well correlated, so it is clearly say that the sound is mainly generated in the shear layer. The results of the test measurement show that the present measurement technique should be a useful tool for analyzing and evaluating the mechanism of generation of aerodynamic noise in the flow. 125mm 100mm Flow Fig. 1 Vorticity map around a rod (2 mm) Fig. 2 Sound Intensity map around a rod (2 mm) 1 1. INTRODUCTION Reducing the aerodynamic noise is one of the major technical issues in the design of many industrial products. Especially in the automotive engineering, aerodynamic noise will disturb the comfort of passengers. Therefore many research works for the experimental analysis of aerodynamic noise concerning the passenger car have been carried out. Relationships between flow and pressure fluctuations were investigated in detail (Stapleford et al., 1971). Hucho studied pressure distribution on the surface of the simplified car models (1987). Haruna measured the flow velocity around a front pillar of the real car, and it was indicated that the strong vorticity in the sheer layer dominates the generation of the aerodynamic noise around the front pillar (1990). On the other hand, the sound field measurements have been done by many researchers. Cogotti had employed an STSF system for measuring sound filed on the wind tunnel testing (1994). Tanaka had employed the arrayed microphone with parabolic reflector, and measured sound field around the front pillar of the passenger car in the wind tunnel (1999). In evaluation for those aerodynamic noises, both sound and flow field characteristics are fundamental information. However, in the most of the work mentioned above, sound and flow fields are measured and evaluated independently. In the present work, a combined measuring technique for sound and flow fields is described. The sound filed measurement has performed with non-stationary STSF system and the flow field has been measured with PIV system. Test measurements are performed by the combined measuring system on the turbulence noise caused by a circular rod in the air flow. An overview of the system is presented along with examples of results obtained in the test measurements. 2. DATA ACQUISITION SYSTEM 2.1 PIV System Figure 3 shows the schematics of the present PIV system for global flow measurement. A 50mJ double pulsed Nd: YAG laser is used as a light source. A DANTEC HiSense cross-correlation camera of 1,280 x 1,024 resolution is used for getting image data. A DANTEC FlowMap 1500 Acquisition and Control Unit with 1 GB LIFO image buffer is employed, which can control the timing of the laser and the camera. Stored image data are transferred from LIFO buffer to the PC via 100 BASE-TX Ethernet. Transferred image data are processed and analyzed by DANTEC FlowManeger software running on the host PC. Whole system timing is triggered and controlled by the software. 2.2 STSF System Sound data are obtained with a B&K Non-stationary STSF system. Figure 4 shows an example of the STSF system equipped with array sensor and front ends. The front-end for signal conditioning is an intelligent Data Acquisition (IDA) front-end system Type 3561. Time-history data is stored in real time in the front-end, and after the recording is completed, data is transferred through a standard Ethernet interface to the host computer running the Non-Stationary STSF software. 2 Figure 5 shows an array sensor with 6 columns and 5 rows of microphones for the present work. The grid spacing is set to 25 mm witch corresponds to the measuring area of 125 x 100 mm. The theory of STSF system is described in the Technical Review of B&K. (2000). 2.3 Data Processing The obtained data of both flow and sound are basically processed on each host computer. The processed data are exported to a data server in text format via Ethernet. Post processing will be done on a data server. Afterwards, statistical data, animations of time-history data, and another post processed data will be obtained. Fig.3 Illustration of DANTEC FlowMap PIV system Fig.4 B&K Non-stationary STSF System Fig. 5 Experimental setup with array sensor 3 3. EXPERIMENTAL SETUP The present system described above was applied to measurements around a rod in the uniform flow in order to verify its practicality as a combined measurement system. Schematic drawing of the experimental setup is illustrated in Fig. 6. Airflow was made by a small Eiffel-type wind tunnel with 60 mm diameter circular nozzle. Hot atomized oil mists were used as the seeding particles for PIV measurements, generated by a DANTEC Safex Fog Generator. Test measurements were applied to the two types of circular rod, one is 2 mm in diameter and the other is 6 mm in diameter. The experiments were conducted at a main flow velocity of 60 m/s. The Reynolds number based on the rod diameter are set at Re = 7,740 for 2 mm diameter rod and Re = 23,200 for 6 mm diameter rod. The rod is set perpendicular to the flow and microphone array of STSF is located out side of the air flow as shown in Fig. 5. PIV camera is located opposite side to the microphone array and facing each other. Blower Nozzle (φ = 60mm) Settling Chamber 33mm Rod Fig. 6 Schematic Drawing of the Experimental Setup 4. RESULTS AND DISCUSSION Mean velocity vector maps are shown in Fig. 7. A large separated flow region is observed behind a rod of 6 mm diameter. However, a smaller wake region is existed on the 2 mm rod condition. The examples of instantaneous vector maps are shown in Fig. 8. Various sizes of the vortexes can be seen in the flow behind a rod in 6 mm diameter. On the other hand, well known Karman vortexes are observed on the vector maps of 2mm rod. Figure 9 illustrates the time-averaged vorticity map. The strong velocity gradient will be formed in the area between the main flow and the wake region. Therefore higher values of vorticity are observed in the shear layer. In the vorticity map of 6mm rod, the distributions of vorticity spread and diffuse wider to downstream and y-direction. 4 (a) Rod of 6mm diameter (b) Rod of 2mm diameter Fig. 7 Mean Velocity Vector Map (a) Rod of 6mm diameter (b) Rod of 2mm diameter Fig. 8 Example of Instantaneous Vector Map (a) Rod of 6mm diameter (b) Rod of 2mm diameter Fig. 9 Time-averaged Vorticity Map 5 On the contrary, the spread of the vorticity is smaller for the 2 mm rod condition. However the peak value of the vorticity is larger than that of 6 mm rod. Maps of turbulence kinematic energy calculated with u and v velocity fluctuations are illustrated in figure 10. The turbulence kinematic energy distribution of 6 mm rod differs from that of 2 mm rod. In the 6mm rod case, larger values of turbulence kinematic energy are observed in the shear layer and the downstream region as well. However, in the 2 mm rod case, the peak value is only observed near the rod. And the turbulence kinematic energy distribution had spread and diffused to downstream. (a) Rod of 6mm diameter (b) Rod of 2mm diameter Fig. 10 Turbulence Kinematic Energy Map 125mm 125mm Flow 100mm 100mm Flow (a) Sound Intensity at the center of the rod (b) Sound Intensity at the center of the rod for 5 kHz 1/3-octave band (6mm rod) for 5 kHz 1/3-octave band (2mm rod) Fig. 11 Time-averaged Sound Intensity 6 Figure 11 shows the time-averaged sound intensity maps. The sound intensity distribution of 6 mm rod differs from that of 2 mm rod. In the 6mm rod case, larger values are observed in the downstream region and spread wider. However, in the 2 mm rod case, the symmetrical two peak distributions are seen in the near rod region. Also spread of the sound intensity of 2 mm rod is relatively smaller than that of 6 mm rod. The results of the sound measurements show that the map of sound intensity is a similitude against that of vorticity. With these results, correlations are seen with vorticity and the sound intensity. 5. CONCLUSIONS A combined measuring technique of sound and flow field measurement is constructed for use of commercial measurement systems. Test measurements are applied to the flow around a circular rod. The result of the experiment clearly shows that the correlation can be observed between sound intensity and the vorticity. As a further task, it will be needed to develop an integrated analysis method for correlation between sound and flow fields. For that purpose, it will be needed to balance the resolution between flow and sound measurement systems. For example, a use of high-speed video camera can improve the time resolution of the PIV system. Or time series data with sufficient resolution can be obtained with combined use of LDA system or hot-wire anemometer. For obtaining higher space resolution of sound data, the grid spacing of the microphone array needs to be set smaller. And/or modifications of the STSF software will be needed. ACKNOWLEDGEMENTS The authors would like to thank Prof. M. Takagi at Tokai University and Mr. N. Kikuchi at Furukawa Electric Co., Ltd. for their suggestions and advises for our work. REFERENCES Cogotti, A. (1994), “Aeroacoustic Testing Improvements at Pininfarina”, SAE Paper 940417. Hald, J. (2000), “Non-stationary STSF”, Brüel & Kjær Technical Review, No. 1 – 2000. Haruna, S., Nouzawa, T., Kamimoto, I. and Sato, H. (1990), “An Experimental Analysis & Estimation of Aerodynamic Noise Using Production Vehicle”, SAE Transactions, Vol. 99, No. 900316. Hucho, W. H. (1987), “Aero Dynamics of Road Vehicles”, Butterworth (England), pp. 250-256. Stapleford, W. R. and Carr, G. W. (1971). “Aerodynamic Noise in Road Vehicles, Part 1: The Relationship between Aerodynamic Noise and the Nature of Airflow”, MIRA Report, No. 1971/2. Tanaka, H., et al. (1999), “Experimental Analysis of Aerodynamic Noise around Road Vehicle, Part 3”, Proc. JSAE Symp., No. 35-99, No. 9933475, (In Japanese). 7
