Range and accuracy of a Laser-Doppler Anemometer for in-flight measurements
advertisement
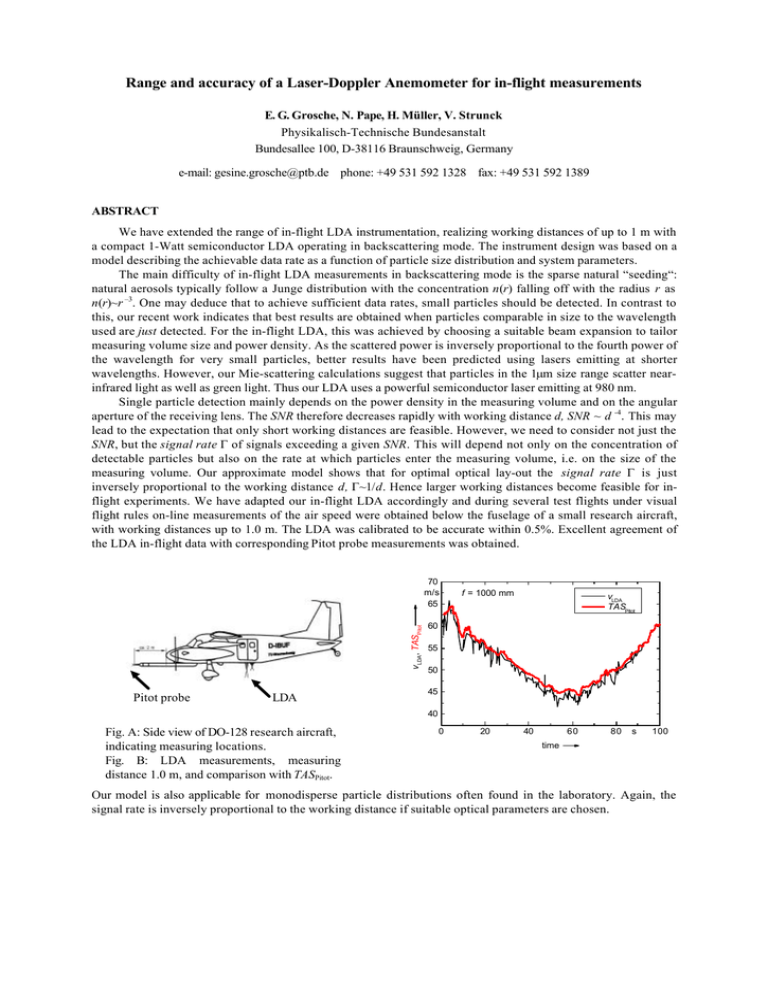
Range and accuracy of a Laser-Doppler Anemometer for in-flight measurements E. G. Grosche, N. Pape, H. Müller, V. Strunck Physikalisch-Technische Bundesanstalt Bundesallee 100, D-38116 Braunschweig, Germany e-mail: gesine.grosche@ptb.de phone: +49 531 592 1328 fax: +49 531 592 1389 ABSTRACT We have extended the range of in-flight LDA instrumentation, realizing working distances of up to 1 m with a compact 1-Watt semiconductor LDA operating in backscattering mode. The instrument design was based on a model describing the achievable data rate as a function of particle size distribution and system parameters. The main difficulty of in-flight LDA measurements in backscattering mode is the sparse natural “seeding“: natural aerosols typically follow a Junge distribution with the concentration n(r) falling off with the radius r as n(r)~r –3. One may deduce that to achieve sufficient data rates, small particles should be detected. In contrast to this, our recent work indicates that best results are obtained when particles comparable in size to the wavelength used are just detected. For the in-flight LDA, this was achieved by choosing a suitable beam expansion to tailor measuring volume size and power density. As the scattered power is inversely proportional to the fourth power of the wavelength for very small particles, better results have been predicted using lasers emitting at shorter wavelengths. However, our Mie-scattering calculations suggest that particles in the 1µm size range scatter nearinfrared light as well as green light. Thus our LDA uses a powerful semiconductor laser emitting at 980 nm. Single particle detection mainly depends on the power density in the measuring volume and on the angular aperture of the receiving lens. The SNR therefore decreases rapidly with working distance d, SNR ~ d -4. This may lead to the expectation that only short working distances are feasible. However, we need to consider not just the SNR, but the signal rate Γ of signals exceeding a given SNR. This will depend not only on the concentration of detectable particles but also on the rate at which particles enter the measuring volume, i.e. on the size of the measuring volume. Our approximate model shows that for optimal optical lay-out the signal rate Γ is just inversely proportional to the working distance d, Γ~1/d. Hence larger working distances become feasible for inflight experiments. We have adapted our in-flight LDA accordingly and during several test flights under visual flight rules on-line measurements of the air speed were obtained below the fuselage of a small research aircraft, with working distances up to 1.0 m. The LDA was calibrated to be accurate within 0.5%. Excellent agreement of the LDA in-flight data with corresponding Pitot probe measurements was obtained. vLDA, TASPitot 70 m/s 65 Pitot probe LDA f = 1000 mm vLDA TASPitot 60 55 50 45 40 Fig. A: Side view of DO-128 research aircraft, indicating measuring locations. Fig. B: LDA measurements, measuring distance 1.0 m, and comparison with TASPitot. 0 20 40 60 80 s 100 time Our model is also applicable for monodisperse particle distributions often found in the laboratory. Again, the signal rate is inversely proportional to the working distance if suitable optical parameters are chosen. 1. INTRODUCTION AND OUTLINE In-flight measurements have been a challenge for many years as an application for laser based anemometry, in particular differential Laser Doppler anemometry (LDA) [1-7]. For boundary layer studies, considerable success with a forward scattering set-up [2, 3] has recently been demonstrated. Often, however, applications call for a backscattering configuration. Early work employing a large pulsed laser [4] was carried out with a working distance of 2 m but gave insufficient data rates. More recently, using more compact laser sources with backscattering configurations, only short working distances of up to 0.12 m with low to very low data rates were reported [6, 7]. Typically, data rates sufficient for statistical analysis were only obtained inside clouds. The main difficulty of in-flight LDA measurements is the sparse natural “seeding“ - natural aerosols typically follow a Junge distribution with the concentration n(r) falling off with the radius as n(r)~r -3, i.e. there are very few large, detectable particles. One may deduce from this that one should aim to detect very small particles with diameters less than 0.5µm [5]. Detection depends on the power density in the measuring volume and on the angular aperture of the receiving lens. Considering this, Stieglmeyer and Tropea [8] pointed out that the SNR decreases with distance as d -4, so that sixteen times the laser power would be required to detect the same particle at twice the measuring distance. This may lead to the expectation that only short working distances are feasible. Finally, for very small particles, the scattered power is inversely proportional to the fourth power of the wavelength. This could indicate that better results may be obtained by using lasers emitting shorter wavelengths. In particular, green Nd:YAG lasers would be superior to near infrared semiconductor lasers of the same power output [3, 7]. In contrast to some of these inferences, our recent work [9] indicates that best results are in fact obtained when particles comparable in size to the wavelength are just detected. Furthermore, if this criterion is fulfilled, an approximate model for the signal rate Γ as a function of optical lay-out predicts a dependence of roughly Γ~1/d, where the working distance d is taken to be the focal length f of the front lens. Finally, numerical Mie scattering calculations for a backscattering configuration suggest that for the particle size range around 1µm (i.e. that chosen for maximum signal rate), near infrared light (980 nm) will be scattered just as efficiently as green light (532 nm). Details of the theoretical model describing data rates obtainable with the sparse but polydisperse “Junge“particle size distributions which are typical of natural aerosols are presented in section 2, including the functional dependence of the data rate on the beam waist and on the working distance. Our model is also applicable to the monodisperse particle distributions often used in the laboratory. We have recently reported results obtained with a dedicated - and at times precarious - very high power (2 Watt) LDA taking in-flight measurements at working distances of up to 0.3 m [7]. The theory now indicates that on-line measurements of air speed may be feasible under visual flight rules at working distances even greater than 0.3 m. A rugged, reliable and well calibrated high power differential LDA with a 1 Watt semiconductor laser was built and used to test this, see section 3. In section 4, we present in-flight data showing three flight manoeuvres monitored simultaneously with a five-point Pitot-probe and with the LDA with working distances of 0.3 m, 0.6 m and finally 1.0 m. Agreement between the mechanical and optical sensor was very good and the data rates of the LDA were sufficient to provide continuous on-line information of the true air speed even at a working distance 1.0 m, in weather conditions where visibility exceeded 10 km. 2. THEORY 2.1. Aim and assumptions of the model We are trying to model how the signal rate Γ of signals exceeding a certain SNR depends on the particle size distribution and on those optical parameters that can be varied given fixed geometrical constraints on the apparatus. The particle size distribution for natural aerosols may be assumed to be given by a power law, (1) n(rI) ~ rI-α, where n(rI) is the concentration of particles with a radius r > rI and α=3 is typical [7]. Optical parameters that can be altered without affecting the overall size of the apparatus may be the laser power PI, the working distance d taken to be the focal length f of the front lens, the beam separation sb and the spot radius WL of the laser beams on the focussing front lens. These parameters determine the power density and size of the measuring volume (msv). We now assume that: • the laser beams are gaussian, i.e.the measuring volume has a radius w0, and length l given by (2a) w0 = fλ/(πWL), (2b) length l ∝ w0 f/sb and (2c) mean power density IM ∝ PI / πw02 • the long axis of the measuring volume is perpendicular to the air velocity v. The rate Γ at which particles with a radius r > rI cross the measuring volume is then given by the particle concentration n(rI) and the volume V swept out per second by the measuring volume: (3a) Γ = n(rI) × V, where (3b) V = v × A, with (3c) the msv cross-section A= π/2 × w0 × l; We approximate the scattered light power PS received over a small aperture (area AL) in a backward direction by (4a) PS = IM × σb(r) × AL/(4π f 2), where σb(r) is the scattering cross section depending on the particle size. 2.2. Signal rate as function of working distance with seeding We first consider what happens to the signal rate Γ when the focal length f is varied but instead of natural aerosols we have the simpler case of “seeding” with a monodisperse particle size distribution. To detect the same particles with the same SNR, we require the same scattered light power PS. Since the angular aperture AL/(4π f 2) decreases quadratically with f, we require a correspondingly higher power density IM in the msv to keep PS constant. This can be achieved by reducing the beam waist w0. If we adjust w0 (through beam expansion prior to the focussing lens) such that (5) w0 = const/ f then the power density IM ∝ PI / πw02 ∝ f 2 will be sufficient for any f to detect the seeded particles. This, however, has some consequences for the data rate Γ : the concentration n(rI) is constant and given by the seeding, but the measuring volume size is decreased with increasing f. Substituting (5) in (2b) and (3c) we obtain: (5b) Γ = n(rI) × V = const. × A = const .× π/2 × w0 × l = const. × w0 × w0 f/sb = const × 1/ (f × sb) that is, the signal rate is inversely proportional to the working distance if the same particles are detected and the optical lay-out is optimal. 2.3. Natural aerosols In the case of natural aerosol particle size distributions, the calculation is somewhat more complicated. First, we need to know for a given working distance f what the optimal optical layout would be in terms of WL (or w0). This depends on the Junge parameter α, and on the radius-dependence of the scattering cross section σ(r). Approximating the scattering function with a monotone and continuous function σ(r):= const × rβ, where β = 2 for very large particles (r >> λ, geometric optics ), β = 6 for (r << λ, Rayleigh scattering) and β ≈ 3 for (r ≈ λ , Miescattering, see [9]), we can invert equation 4a as a function of w0 (because IM depends on w0) to obtain the radius of the smallest particles still giving sufficient scattered light power Pmin. This determines the detectable particle concentration n detect ∝ (PI / Pmin) α/β × w0-2 α/β However, for fixed f the measuring volume cross section A is proportional to w02 (eqn. 2b and 3c). We therefore obtain: (6) ΓSNR ∝ (PI / Pmin) α/β × w0-2 α/β × v × w02 As described in more detail in [9] (the eqn. numbering is consistent with the one used here), the signal rate is determined by these two competing effects: the detectable particle concentration varying as w0-2 α/β on one hand and the “collision tube volume” given by the product of air velocity and the cross-section of the measuring volume, which varies as w02, on the other. It then turns out that for any f it is best to adjust WL and thereby w0 so that the same particles, those with a radius comparable to the wavelength, are detected [9]. This is referred to as the Mie-region, because the light scattering cannot be described by either geometric or Rayleigh approximations. Within the Mie-region the signal rate is then independent of the beam waist w0 or the beam spot size WL. Because the same particles are detected independent of the focal length, we have recovered the more simple case described in section 2.2.: as for the monodisperse particle size distribution, we would thus expect the signal rate to be inversely proportional to the working distance. This can be seen even more clearly by including the dependence of the signal rate on the focal length explicitly: (6a) ΓSNR ∝ (PI / Pmin) α/β × (AL/4π) α/β × v × (λ/πWL)2 (1-α/β) × f 3−4α/β × 1/sb Given α = 3, Γ is maximal for β = 3 (approximately the case in the Mie-region), where the dependence on WL vanishes and 3−4α/β = -1 so that (7) ΓSNR ∝ (PI / Pmin) α/β × (AL/4π) α/β × v × 1 × 1/(f × sb ) This shows that for a natural aerosol distribution - as found during in-flight experiments - the signal rate will be approximately inversely proportional to the working distance, if an optimised LDA set-up is used. 3. INSTRUMENTATION The optical set-up of the LDA is based on the standard differential LDA configuration, with significant adaptations for in-flight measurements, see figure 1. LASER LASER BExp BS D DL M FL BExp BS D DL - 1 Watt MOPA laser - beam expansion & shaping - beam splitter - avalanche photo detector with pin hole and spectral filter - detector lens, f = 90 mm - 45° mirror - front lens, f = 300, 600 or 1000 mm M FL measuring direction Fig. 1: Optical layout of the LDA for in-flight measurements shown schematically. This includes a 1 Watt laser source, optimised power throughput, adjustable measuring volume lay-out, high mechanical stability and accuracy. The working dis tance of the LDA was varied by exchanging the front lens, with focal lengths of 300 mm, 600 mm and 1000 mm being used. Adjustable beam shaping and expansion simplified proper beam waist alignment and allowed optimisation of the measuring volume lay-out for each measuring distance, so as to maximise data rates. For the wavelength used (980 nm), our theory suggests that the power density in the measuring volume should be adjusted so that particles about 1 µm in diameter are detected. In practice, this is achieved by choosing an appropriate beam expansion. The mean power density in the measuring volume was of the order of 10 MW/m2. Fringe distance variations across the measuring volume were minimised, and calibration of the LDA-system gave an overall measuring uncertainty of less than 0.5 %. 4. FLIGHT EXPERIMENTS The LDA, its power supply and a lap top computer for on-line signal analysis were mounted inside the cabin of a DO-128 two propeller research aircraft. The LDA was mounted on shock-mounts on the floor of the cabin, with optical access provided through a hatch in the floor. The measuring volume was located f - 0.015 m below the fuselage of the aircraft, were f is the focal length of the front lens used. Air speed was also measured with a Pitot probe located at the tip of a 2 m nose boom in front of the aircraft, see figure 2. All flights were conducted at altitudes below 1500 m in sunny LDA weather conditions permitting flight according to visual flight rules. A particle counter was operated during some of the flights - particle size distributions were as expected Junge type, with less than one particle larger than 1 µm in diameter per cm3 of air. Pitot probe LDA Fig. 2a,b: Front and side view of DO-128 research aircraft, indicating measuring locations. vLDA, TASPitot 80 m/s 75 f = 300 mm Fig. 3: LDA data (vLDA) measuring distance 0.3 m, and Pitot-probe data (TASPitot) as function of time during a flight manoeuver, causing natural longitudinal oscillation of the aircraft. Hollow circles signify average of ten signals. Signal rate 9 Hz. 70 65 60 55 < vLDA>, n =10 TAS Pitot 50 0 20 40 60 s 80 time 80 Fig. 4: LDA measurements, measuring distance 0.6 m, comparison with TASPitot, acclerating manoeuver. Every data point (hollow circles) shown, and average of 10 signals as continuous line. Signal rate 4 Hz. f = 600 mm m/s vLDA, TASPitot 70 60 50 vLDA <vLDA>, n =10 TASPitot 40 0 vLDA, TASPitot 70 m/s 65 20 40 60 80 time f = 1000 mm 100 120 s 140 vLDA TASPitot Fig. 5: LDA measurements, measuring distance 1.0 m, comparison with TASPitot. Deceleration and subsequent acceleration; every data point shown, continuous line. Signal rate 2 Hz. 60 55 50 Note detailed agreement of small scale fluctuations of air speed in both curves. 45 40 0 20 40 60 time 80 s 100 The LDA was operational throughout all flights, and high quality signals (SNR > 10 dB) were detected continuously at an adequate rate for all measuring distances. The feasibility of obtaining continuous on-line velocity information is shown by LDA data taken during three flight maneouvers, each with a different measuring distance. These flight maneouvers were: a) forced natural longitudinal oscillation of the aircraft, with periodical variation of both air speed and altitude, LDA working distance 0.3 m (figure 3), b) acceleration from lowest to highest permitted air speed, LDA working distance 0.6 m (figure 4) and c) deceleration and subsequent acceleration, with LDA working distance 1.0 m (figure 5). We note that agreement of LDA and Pitot probe measurements is very good, especially considering the different measuring locations and the wide range of velocities and angles of attack. Measurements at 0.3 m below the fuselage are almost certainly affected by the rather thick boundary layer [9]. While all LDA data may be influenced by the propeller jets (Fig. 2), levels of turbulence were below 2 % at measuring distances of 0.6 m and 1.0 m. We further note the surprisingly good agreement of the observed signal rates with theory: as mentioned in section 2, our model predicts that the signal rate is inversely proportional to the measuring distance, which is also what we have observed. 5. CONCLUSIONS We have demonstrated that the measuring distance of semiconductor LDAs used for in-flight measurements can be extended considerably if a high power laser is employed and the measuring volume layout is optimised for the measuring distance. The SNR decreases with the fourth power of the measuring distance if no optimisation is carried out, SNR ∝ d -4, but when the correct beam expansion is chosen, the signal rate Γ need only decrease in proportion to the increase of the measuring dis tance, Γ ∝ 1/d. Natural aerosols in the air1 appear to be sufficient to obtain adequate signal rates with a high power backscattering LDA at measuring dis tances of up to 1 m. Continuous, on-line measurements of the airspeed obtained below the fuselage of the research aircraft have been shown to be in good agreement with data provided by a Pitot probe. 6. REFERENCES [1] Ewald B., Durst F., Krause E. and Nitsche W.: In-flight measuring techniques for laminar flow wing development, Zeitschrift f. Flugwiss. u. Weltraumforschung, 17 (5) pp. 294-310, 1993 [2] Suttan J., Baumann M., Frühling S., Becker S., Lienhart H. and Stemmer C.: In-flight research on boundary layer transition. New Results in Numerical & Exper. Fluid Mech., STAB/DGLR Symposium, Braunschweig 1996 in: Notes on Num. Fluid Mech. 60, pp. 343-350. [3] Becker S., Durst F. and Lienhart H.: Laser Doppler Anemometer for In-Flight Velocity Measurements on Airplane Wings. AIAA Journal 37 (6) June 1999. [4] Mainone D. and Bouis X.: Verwendung eines Farbstofflasers mit hoher Spitzenleistung und langer Pulsdauer zur Messung der Luftgeschwindigkeit vom Flugzeug aus. Z. Flugwiss. Weltraumforsch., 2 p.3, 1978. [5] Durst F., Lienhart H. and Müller R.: Application of a semiconductor-LDA for inflight measurements. 6 th Int. Symp. on Appl. of Laser Techniques to Fluid Mech., July 1992, Lisbon, 11.3. [6] Jentink H. W., Stieglmeier M. and Tropea C.: In-Flight Velocity Measurements Using Laser Doppler Anemometry. Journal of Aircraft 31 (2), pp 444-446, 1993. [7] Beversdorff M., Förster W., Schodl R. & Jentink H. W.: In-flight Laser Anemometry for Aerodynamic Investigations on an Aircraft. Optics and Lasers in Engineering 27, pp.571-586, 1997. [8] Stieglmeyer M. and Tropea C.: Mobile fiber-optic laser Doppler anemometer. Applied Optics 31 (21), July 1992. 1 At altitudes below about 1.5 km. There is a considerable decrease in particle concentration at higher altitudes. [9] Grosche G., Müller H., Strunck V. and Dopheide D.: In-flight measurements with a Laser-Doppler Anemometer using two Semiconductor Lasers. Proceedings of the 8 th Int. Conf. on Laser Anemometry: Advances and Applications. 6.-8.9.1999, Rome, pp. 147-154. ACKNOWLEDGEMENTS This work would not have been possible without the help and co-operation of fellow researchers in the collaborative research centre “Sonderforschungsbereich 420 - Flugmeßtechnik”, for which financial support by the German Research Foundation (DFG) is gratefully acknowledged. We would like to thank test pilot Dipl.-Ing. Rolf Hankers and approval engineer Dipl.-Ing. Helmut Schulz for flying the aircraft (including interesting maneouvers) and for the expert help mounting the apparatus securely. We are also indebted to Gerko Wende for making the Pitot probe data available to us.
