Engineering Math II – Spring 2015 Quiz #2 Name:
advertisement
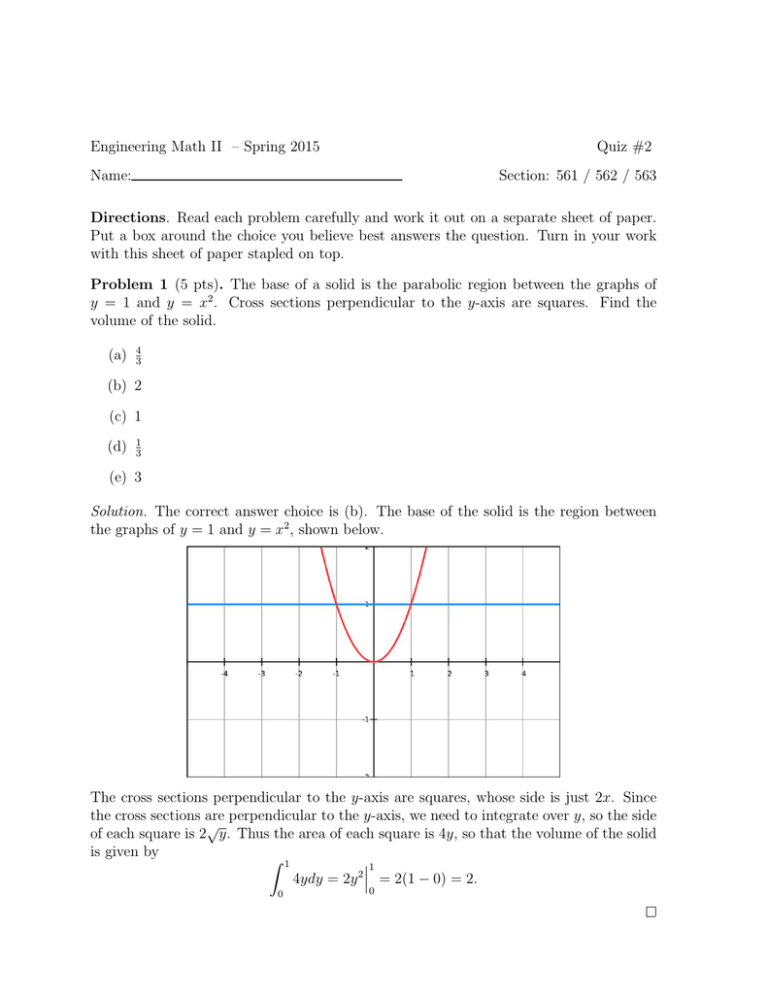
Engineering Math II – Spring 2015 Quiz #2 Name: Section: 561 / 562 / 563 Directions. Read each problem carefully and work it out on a separate sheet of paper. Put a box around the choice you believe best answers the question. Turn in your work with this sheet of paper stapled on top. Problem 1 (5 pts). The base of a solid is the parabolic region between the graphs of y = 1 and y = x2 . Cross sections perpendicular to the y-axis are squares. Find the volume of the solid. (a) 4 3 (b) 2 (c) 1 (d) 1 3 (e) 3 Solution. The correct answer choice is (b). The base of the solid is the region between the graphs of y = 1 and y = x2 , shown below. The cross sections perpendicular to the y-axis are squares, whose side is just 2x. Since the cross sections are perpendicular to the y-axis, we need to integrate over y, so the side √ of each square is 2 y. Thus the area of each square is 4y, so that the volume of the solid is given by Z 1 1 2 4ydy = 2y = 2(1 − 0) = 2. 0 0 MATH 152:561-563 – Spring 2015 Quiz #2 2 Problem 2 (5 pts). Find the volume of the solid formed by rotating the region bounded by x = 0, y = ln(x), y = 0, and y = 2 about the y-axis. (a) π 4 e 2 (b) π 4 e 2 −1 (c) πe4 − 1 (d) π 2 (e) π 4 (e 2 − 1) Solution. The correct answer choice is (e). The region to be rotated is shown below. Cross sections of the resulting solid perpendicular to the y-axis are discs with radius x. Hence the area of each disc is πx2 . Since the cross sections are perpendicular to the y-axis, we need to find the area in terms of y. To do so, note that if y = ln(x), then x = ey . Hence the are of each disc, in terms of y, is πe2y . Thus the volume of the solid is given by Z 2 π 2y 2 π 4 2y πe dy = e = (e − 1). 2 2 0 0 MATH 152:561-563 – Spring 2015 Quiz #2 3 Problem 3 (5 pts). Which of the following represents the area between the curves y = and y = 6 on the interval from x = 1 to x = 4? R 4 12 (a) 1 x − 6 dx (b) R2 (c) R4 (d) R 12 12 (e) R6 1 1 3 3 6− 12 x 6− 12 x y dx + R 4 12 2 x 12 x − 6 dx dx − 1 dy 4− 12 y dy + R 12 12 6 y − 1 dy Solution. The correct answer choice is (e). This can be deduced by a process of eliminationg. The graph of the two curves is given below. Clearly (a) cannot be the correct answer, since the function y = 12 is not always the “top” x function. For similar reasons, (c) cannot be the correct answer. Choice (b) looks like it might be correct, but on the interval from x = 1 to x = 2, y = 12 is the top function, x not 6, so this cannot be the right choice. This leaves choices (d) and (e), both of which are integration over the y-axis. However, (d) cannot be the correct choice, because even is not always the “top” function. when integrating over the y-axis, the function x = 12 y This leaves only choice (e). MATH 152:561-563 – Spring 2015 Quiz #2 4 Problem 4 (5 pts). Find the area of the region bounded by y = cos(x), y = −1, x = 0 and x = π2 . (a) π π 2 (b) (c) 1 + π 2 (d) −1 + π 2 (e) π 2 +2 Solution. The correct choice is (c). We can split the computation into two parts. First we find the area under y = cos(x) from x = 0 to x = π2 . Then we find the area “under” the curve y = −1. The total area will be the sum of these two. That is, the are of the region is given by Z π/2 Z cos(x)dx + 0 0 π/2 π/2 π π π dy = (sin(x) + x) = sin( ) + − (0 + 0) = 1 + . 2 2 2 0
