TIPS-JIM Meeting 15 September 2005, 10am, Auditorium
advertisement
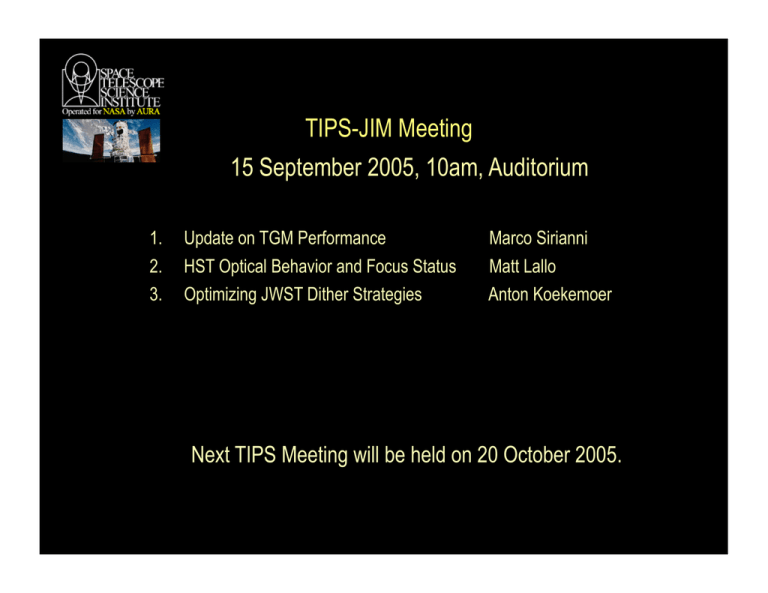
TIPS-JIM Meeting 15 September 2005, 10am, Auditorium 1. Update on TGM Performance Marco Sirianni 2. 3. HST Optical Behavior and Focus Status Optimizing JWST Dither Strategies Matt Lallo Anton Koekemoer Next TIPS Meeting will be held on 20 October 2005. TIPS Sep 15, 2005 Update on TGM operation Presented by Marco Sirianni Credits for TGSMOV Planning: G. Chapman, M. Reinhart, A. Vick ACS: J. Biretta, C. Cox, A. Koekemoer, R. Lucas, J. Mack, C. Pavlovsky, C. Proffitt, M. Richardson, K. Sembach, M. Sirianni. NICMOS: S. Arribas, R. de Jong S. Malhotra, K.Sahu A. Schultz, C. Xu,, TGM transition • HST successfully transitioned to TGS mode on August 28th (gyro pair 1-2). GYRO # Before 8/28/05 After 9/1/05 1 ON ON 2 ON ON 3 Non functioning Non functioning 4 ON OFF 5 Non functioning Non functioning 6 OFF OFF Jitter magnitude • Typical boresight jitter in 3 gyro: 3-5 mas (60 sec) B. Clapp Gyro 1-2: best pair for jitter and disturbance rejection TGSMOV Several programs aimed to assess the on-orbit performance: – Comparison with 3G mode – Comparison with February 2G test (Gyro pair 2-4) Instrument ACS NICMOS Program Goal Status 10458 HRC PSF- pointing 3 clusters- dither Completed 10459 HRC PSF- pointing CVZ Target Planned Oct 15, 2005 10460 10461 10464 10462 Coronography Completed Moving Target Completed PSF Completed Coronography Completed ACS/HRC PSF Sirianni, Lucas, Pavlovsky, Mack NGC 2298 HRC F555W 10 sec Data: Multiple exposures of three rich star clusters with HRC F555W. Different exposure time: 10, 100, 500 sec Bright (V~13) and Faint (v~14) guide star Analysis: FWHM measurement for stars with S/N > 10 ACS/HRC PSF 2 Gyro: August 2005 144 Frames FWHM (pixels): 2.036+/- 0.039 Min:1.95 Max: 2.19 2 Gyro: February 2005 158 Frames FWHM (pixels): 2.009+/- 0.026 3 Gyro: Historical (2002-2004) 124 Frames FWHM (pixels): 2.041+/- 0.034 3 Gyro (Feb 05) 1.987+-/0.016 3 Gyro (Apr-Aug 05) 2.031+/0.040 ACS/HRC PSF NGC 2298 Aug 29 2005 2G NGC 416 Aug 12 2005 3G Images are displayed in logarithmic scale. Cosmic ray rejection and correction for geometric distortion have not been applied.. Current results agree with previous 2G tests and 3G performance. HRC/PSF - results We confirm that, as seen in 3G and in the 2G test in February: • The PSF FWHM does not show any dependence on the brightness of the guide star • The PSF FWHM in long exposure frames is slightly broader than in short exposure frames We also have two minor items under investigation: •! One of the target show a PSF systematically broader than the other two. (It will be revisited as CVZ target) •! The PSF fwhm increases systematically within each orbit FWHM vs Target 2.026+/- 0.030 2.030+/- 0.033 2.088+/- 0.040 NGC 2298 RA: 06:48:59 DEC:-36:00:19 SunAngle ~ 70 MoonAngle ~64 NGC 1851 RA: 05:14:08 DEC:-40:03:00 SunAngle ~ 89 MoonAngle ~78 NGC 6752 RA: 19:10:52 DEC:-59:59:04 SunAngle ~ 115 MoonAngle ~142 FWHM vs Time 10458 Visit L2: 4x10 sec 4x100 sec 4x10 sec 2x500 sec 10 sec 100 sec 500 sec The PSF gets broader with time within any orbit. The variations are bigger than those due to the increased exposure time. PSF variation within orbits • Same pattern observed in all orbits. • It does not seem to change with terminator crossing. • Although this pattern was not as evident in the February test, we see it in some recent 3G data. • It is likely a normal breathing effect (see next talk) Similar comparison with recent 3G data Three different star clusters: 2x35 sec + 4x300 sec Apr 05 Jun 05 Aug 05 Significant variation within an orbit seen also in 3G ACS/HRC Pointing Koekemoer ACS/HRC pointing Comparison with February 2-gyro test and 3-gyro data obtained under similar conditions. Total Shift r.m.s. (milliarcsec) Roll Angle r.m.s. (degrees) 2-Gyro (Feb) 2.29 0.00097 2-Gyro (Aug) 2.08 0.00070 3-Gyro 2.19 0.00093 Pipeline Processing Test - MultiDrizzle: Combined output for 10 exposures - successful, nominal Current results agree with previous 2G tests and 3G performance. ACS/Coronography Cox • F775W Coronagraph Images 3-gyro 2-gyro Normalized Counts ACS Coronography Arcsecond s Current results agree with previous 2G tests and 3G performance. Moving Target Test C. Proffitt • 32 x 0.3 S F435W HRC images of Mars over 1 orbit. • Rotation of Mars and movement of surface features complicates cross correlation of images to find shifts There seems to be an apparent shift in pointing for Mars observations which is roughly consistent with the effect of a 2.4 s error in HST’s position along its orbit (~15 km) on the calculated parallax correction. It could be an effect also present in 3G Retrospective ephemeris will be used to compare to ephemeris used on orbit. NICMOS/PSF Malhotra et al. •! NIC2 PSF is consistent with previous observations •! NIC1 PSF is broader than expected. Quite likely the target is not a point source. NICMOS/Coronohraphy Observations of HD 17925, G star, V=6.0 F160W F110W Direct image Coronagraphic image Acquisition successful, repeatable Summary • TGM since August 28 • HST is operating as good as usual • Instruments performance is still excellent •! We are currently tracking few minor items –! Image shifts in Mars operations –! Small PSF width changes in one target and within orbits •! TGSMOV will be completed in mid October •! Final summary will be presented at the calibration workshop at the end of October TIPS-JIM Meeting 15 September 2005, 10am, Auditorium 1. Update on TGM Performance Marco Sirianni 2. 3. HST Optical Behavior and Focus Status Optimizing JWST Dither Strategies Matt Lallo Anton Koekemoer Next TIPS Meeting will be held on 20 October 2005. TIPS 15Sep2005 TELBranch HSTOpticalBehavior &FocusStatus M.Lallo,R.Makidon,S.Casertano HST Optical Telescope Assembly (OTA) TIPS 15Sep2005 TELBranch HST Optical Telescope Assembly (OTA) ,IGHT3HIELD 'RAPHITE%POXY 4ELESCOPE4RUSS #ENTRAL"AFFLE 3ECONDARY -IRROR !SSEMBLY 3PIDER3UPPORT &OCAL0LANE !LUMINUM &ORWARD3HELL #/ 34! 2 34)3 .)#-/3 0RIMARY-IRROR !#3 7&0# TIPS 15Sep2005 TELBranch Timescales & Mechanisms TIPS 15Sep2005 TELBranch HST experiences variations in focus, coma, & astigmatism (as measured through the SIs) on a number of different timescales. From shortest to longest: 1. Orbital (“breathing”) 2. Medium-Short-Term (“wandering”) 3. Medium-Long-Term (seasonal/annual) 4. Long-Term (desorption) Orbital Effect on Focus (“breathing”) TIPS 15Sep2005 TELBranch HST focus displays a clear orbital period - Identified in 1993 by P. Bely with FOC data. - SM despace in µm empirically found = 0.7(LS-MLS)+K - Variable offset K reflects the “wandering” of the orbital mean focus. - Scale factor known to vary slightly with SI, however recent (2005) HRC data shows excellent agreement with above model using original scale factor. - Implies aft light shield temperatures are still primary drivers for orbital focus variations. - Heating of radiation. the SM support structure is driven by IR from earth and solar TIPS 15Sep2005 TELBranch Orbital Effect on Focus (“breathing”) HRC measured focus (blue) and Bely “breathing” model: ACS/HRC Focus Measurements & Lightshield Breathing Model 0.0 Focus (in microns @ Secondary Mirror) -0.5 -1.0 -1.5 -2.0 -2.5 -3.0 -3.5 -4.0 -4.5 -5.0 17.00 17.25 17.50 17.75 18.00 18.25 18.50 18.75 19.00 Hours (Day 2005.142) 19.25 19.50 19.75 20.00 20.25 20.50 Orbital Effect on Coma & Astigmatism TIPS 15Sep2005 TELBranch Coma & Astigmatism show an orbital signature - Thermally induced motion of the SM is likely to also include tilts and decenters. - With HRC (well-sampled & off-axis) we can accurately measure coma and astigmatism which could be induced by such motions. - We identify orbital signatures in coma and astigmatism; behavior appears repeatable but more complex than focus (no model yet). - Aberrations can be mapped back to tilts & decenters of optical elements using ZEMAX model of OTA+HRC - Ongoing analysis suggests relatively large motions if induced only by HST SM. - More data will be obtained via Cycle 14 Optical Monitor Program, 10752. TIPS 15Sep2005 TELBranch Orbital Effect on Coma & Astigmatism Coma & astigmatism in HRC over 2 consecutive orbits ACS/HRC AOA Test: Y-Coma v. Time ACS/HRC AOA Test: X-Coma v. Time 0.003 0.000 0.002 -0.001 0.001 -0.002 0.000 -0.003 X-Coma -0.004 -0.002 -0.003 -0.005 -0.007 AOA Test (Orbit 1) AOA Test (Orbit 2) -0.008 -0.006 -0.007 17.00 -0.005 -0.006 -0.004 -0.009 17.25 17.50 17.75 18.00 18.25 18.50 18.75 19.00 19.25 19.50 19.75 20.00 20.25 -0.010 17.00 20.50 AOA Test (Orbit 1) AOA Test (Orbit 2) 17.25 17.50 17.75 18.00 18.25 0.012 0.011 0.011 0.010 0.010 0.009 0.009 0.008 0.008 0.007 0.007 0.006 0.006 0.005 0.005 Y-Astigmatism 0.012 0.004 0.003 0.002 19.25 19.50 19.75 20.00 20.25 20.50 AOA Test (Orbit 1) AOA Test (Orbit 2) 0.004 0.003 0.002 0.000 0.000 -0.001 -0.001 -0.002 -0.002 -0.003 AOA Test (Orbit 1) AOA Test (Orbit 2) -0.004 -0.005 -0.005 -0.006 17.00 19.00 0.001 0.001 -0.004 18.75 ACS/HRC AOA Test: Y-Astigmatism v. Time ACS/HRC AOA Test: X-Astigmatism v. Time -0.003 18.50 Hours (Day 2005.142) Hours (Day 2005.142) X-Astigmatism Y-Coma -0.001 17.25 17.50 17.75 18.00 18.25 18.50 18.75 19.00 Hours (Day 2005.142) 19.25 19.50 19.75 20.00 20.25 20.50 -0.006 17.00 17.25 17.50 17.75 18.00 18.25 18.50 18.75 19.00 Hours (Day 2005.142) 19.25 19.50 19.75 20.00 20.25 20.50 Medium-Short-Term “Wandering” TIPS 15Sep2005 TELBranch Mean orbital focus varies over timescales of many orbits - Identified early in HST mission as a trend toward negative focus (SM closer to PM) during near anti-sun pointings (e.g. Mars opposition). - focus wandering seen in science programs observing stellar targets over days. - Results in an unknown offset to the orbital breathing model for each orbit. - An empirical model (Hershey 1997) fitted measured focus with spacecraft attitude and sun/earth aspect. Model broke down as long-term baseline became more complex. Coma and astigmatism have not been as well sampled over this mid-frequency but may experience similar behavior. Medium-Short-Term “Wandering” TIPS 15Sep2005 TELBranch Focus behavior over one week as predicted by the Hershey attitude-based model. Trends can be significantly larger than the orbital variation (high frequency structure): Medium-Long-Term (seasonal/annual) TIPS 15Sep2005 TELBranch Annual period - We see some suggestion of negative focus (smaller truss, cooler temperatures) in autumn months. Magnitude ~3 µm SM. - Possibly related to the annual variation in solar intensity and seasonal effects. - We also observe an annual sinusoid in astigmatism. - Shorter-term variations (~2 months) have also been seen in NICMOS and WFPC2 data (Suchkov & Hershey 1998) Focus data obtained with HRC since early 2002 folded to 1 year. Units are expressed in µm at SM Medium-Long-Term (seasonal/annual) TIPS 15Sep2005 TELBranch Astigmatism component (Z5) observed in HRC. Blue bars represent peak to peak spread of astigmatism values due to orbital effects. Units are µm rms wavefront error. 0.015 0o-Astigmatism measured at HRC 0.010 0o-Astigmatism (in microns) 0.005 0.000 -0.005 -0.010 -0.015 Jan-04 Feb-04 Mar-04 Apr-04 May-04 Jun-04 Jul-04 Aug-04 Sep-04 Oct-04 Nov-04 Dec-04 Jan-05 Feb-05 Mar-05 Apr-05 May-05 Jun-05 Jul-05 Aug-05 Sep-05 Oct-05 Long-Term Desorption TIPS 15Sep2005 TELBranch Secular behavior is a persistent shrinking of OTA - Since HST deployment in April 1990, the separation between the SM & PM has decreased by over 150 µm (0.003% of the 5 meters separating them). - There have been 21 documented SM despace adjustments to maintain observatory focus. - early in the mission, refocusings were frequent and of large magnitude (~20 µm) - adjustments are currently rare (two since January 2001, <5µm each) - Shrinkage followed an exponential until late 1998 when the trend, though shallow, became more erratic. - exponential shrinkage understood to be due to desorption of the graphite epoxy truss in vacuum. - behavior in current epoch not well understood. There appears to be little publicly available data on graphite epoxy structures in space for 15 years. Long-Term Desorption Shrinkage of OTA Metering Truss over Mission Life TIPS 15Sep2005 TELBranch TIPS 15Sep2005 TELBranch Current Focus State Observed means & orbital spreads of focus monitor data from HRC approx. monthly since 2002. Refocusings are indicated. ACS/HRC Focus Measured Over ACS Life Microns of Secondary Mirror Despace 15 10 HST refocus 2 Dec 2002 +3.6 microns HST refocus 22 Dec 2004 +4.2 microns 5 0 -5 -10 -15 01/1/02 01/1/03 01/1/04 01/1/05 01/1/06 Challenges TIPS 15Sep2005 TELBranch The main challenges are: - to maintain best overall observatory focus. - to model PSF variations at an appropriate level of effort. - to understand their impacts to science and operations. Maintaining average focus close to optimal on timescales of months benefits science. - PC & ACS are nearly parfocal (~1µm); focus variations by ~3µm alter the PSF noticeably. - NIC1 & 2 are brought to optimal focus with a consistent PAM setting. - short-term variations preclude focus control to better than ~3µm. Modeling PSF variations is incomplete and ongoing. -effects induced at the SIs are known to contribute though the amounts in most cases are not well understood. Understanding the PSF variations can help assess impacts to science in areas such as weak lensing, and other programs relying on a well characterized or stable PSF. TIPS 15Sep2005 TELBranch Instrument Science Report, ISR-TEL-2005-03 “in press” will be available at http://www.stsci.edu/hst/observatory/documents/isrs TIPS-JIM Meeting 15 September 2005, 10am, Auditorium 1. Update on TGM Performance Marco Sirianni 2. 3. HST Optical Behavior and Focus Status Optimizing JWST Dither Strategies Matt Lallo Anton Koekemoer Next TIPS Meeting will be held on 20 October 2005. STScI TIPS/JIM 15 September 2005 Optimizing JWST Dither Strategies Anton Koekemoer (INS) 42 Optimizing JWST Dither Strategies Anton Koekemoer (INS) with assistance from Kevin Lindsay (DAB) Goals of the study: Present the principal scientific drivers for different dither patterns, in the context of the science goals outlined in the JWST DRM Define metrics to quantify advantages/disadvantages of dither patterns Carry out simulations of different dither patterns and calculate metrics Discuss optimization of dither patterns, including overhead issues Methodology: Concentrate on NIRCam with the most detailed simulations: – numerically simulated exposures with different dither patterns – analytic calculations of overhead times associated with various dither patterns Extend results to FGS-TF, MIRI imaging modes Consider spectroscopic issues related to MIRI/IFU,LRS and NIRSpec Reference: Koekemoer & Lindsay, “An Investigation of Optimal Dither Strategies for JWST”, STScI-JWST-R-2005-0002-A, July 2005 [circulated for approval] STScI TIPS/JIM 15 September 2005 Optimizing JWST Dither Strategies Anton Koekemoer (INS) 43 Science Drivers for Dithering Improve sub-pixel PSF sampling: Several DRM programs require high spatial resolution: e.g., faint white dwarfs in globular clusters; AGN/galaxy connection; weak lensing, ... Most severely undersampled instruments are: – FGS-TF (1 - 5 μm: 65 mas/pix) - only Nyquist sampled above ~4 μm – NIRCam with two wavelength channels: • 0.6 - 2.3 μm: 31 mas/pix - only Nyquist sampled above ~2 μm • 2.4 - 5 μm: 65 mas/pix - only Nyquist sampled above ~4 μm – NIRSpec has two different types of undersampling: • 0.6 - 5 μm: 100 mas/pix - undersampled across entire wavelength range • MSA shutters: 200x450 mas, spaced on a 250x500mas grid Note that MIRI is relatively well sampled: 5 - 27 μm, 110 mas/pix Note - sampling vs. resolution: Sub-pixel dither and small output scale (1/2, 1/3) provides good sampling Removing extra convolution by pixel size (“pixfrac”) improves resolution STScI TIPS/JIM 15 September 2005 Optimizing JWST Dither Strategies Anton Koekemoer (INS) 44 Science Drivers (cont’d) Improved astrometry and photometry: Precise photometry is required by some DRM programs, including halo population studies and globular cluster stellar photometry Intra-pixel sensitivity variations cause photometric errors, hence also affecting astrometry, in single exposures - effect can be up to ~0.4 mags in HST/NIC3 (Lauer 1999) Mitigated by dither patterns to sample sub-pixel sensitivity structure: the additional variance from this effect decreases as ~1/N dither points Improved background subtraction: Many DRM programs are aimed at faint sources, often a few orders of magnitude fainter than the background Variations in background (time-dependent, or intrinsic limitations in flatfield calibration accuracy) propagate into background subtraction Mitigated by dither patterns that sample the scales of background variations across the detector STScI TIPS/JIM 15 September 2005 Optimizing JWST Dither Strategies Anton Koekemoer (INS) 45 Science Drivers (cont’d) Dithering to avoid detector gaps, blemishes etc: All these represent pixels with lost information that needs to be recovered Even programs that don’t require contiguous imaging of large regions will likely still want to cover the gaps between the 2x2 NIRCam detectors (similar to the 2” chip gap in ACS) Large-scale mosaic dithering: Some DRM programs require contiguous imaging of regions much larger than the detector (~100 or more pointings): e.g. weak lensing; rich clusters Large-scale dithers can be combined with smaller-scale patterns to mitigate other effects previously discussed Requirements are: – good acquisition accuracy to minimize overlap required between pointings – maintaining a similar orient for all pointings, to minimize overlap required Also need to consider overhead time due to dither slews / filter changes: this requires specific trade-off studies for various observing schemes STScI TIPS/JIM 15 September 2005 Optimizing JWST Dither Strategies Anton Koekemoer (INS) 46 Metrics for Optimizing Dither Patterns Philosophy: In order to determine which patterns are “optimal”, define metrics that provide a quantitative description for a given dither pattern: – “Positive” metrics that show how well a given measurable quantity can be recovered from the data, for a given dither pattern – “Negative” metrics that reflect various costs associated with carrying out a given dither pattern The trade-offs may be different, depending on the type of science “Positive” metrics: Morphological properties (incl. FWHM, etc.) Astrometric centroiding precision Photometric precision “Negative” metrics: Overhead time from dithering maneuvers, filter changes, etc. Area coverage lost near the edges of the field STScI TIPS/JIM 15 September 2005 Optimizing JWST Dither Strategies Anton Koekemoer (INS) 47 Measuring Metrics for Simulated Data NIRCam - properties: NIRCam will likely be the dominant imager at short wavelengths (<5 μm) and is also relatively undersampled Two optical trains, each with five 20482 sensor chip assemblies (SCAs): – 0.6 - 2.3 μm: 31 mas/pix, 2x2 array of SCAs, 5” gap, undersampled < 2 μm – 2.4 - 5 μm: 65 mas/pix, one SCA, undersampled < 4 μm Assume read-noise = 15 e-/pix; dark current = 0.01 e-/s/pix Filters: F070W, F110W, F150W, F200W, F270W, F357W, F444W Simulations: Concentrate initially on 5 sub-pixel dither patterns: – 1/2-pixel dithers: 2pt-line; 4pt-box, 4pt-box with short & long λ matched – 1/3-pixel dithers: 3pt-line; 9pt-box For each dither pattern, create a set of dithered exposures for each filter: – populated with 1024 stars (32x32 grid), offset randomly in sub-pixel space – nominal JWST PSF (obtained from S. Casertano / A. Sivaramakrishnan) – count-rate uniformly sampled from 0.01 - 10 counts/s STScI TIPS/JIM 15 September 2005 Optimizing JWST Dither Strategies Anton Koekemoer (INS) Example Simulated NIRCam Image Images created: For each of the 5 dither patterns For each of the 7 filters Total of 154 dithered 20482 images Each image contains 1024 stars, separated by 64 pixels, with random shifts added up to 1 pixel Image simulation software provided by S. Casertano / E. Morse Example image (right): F270W Processing: Images were combined using MultiDrizzle (Koekemoer et al. 2002) Final drizzled image has pixel scale = 0.5x input pixel size Combined drizzled images used in subsequent analysis 48 STScI TIPS/JIM 15 September 2005 Optimizing JWST Dither Strategies Anton Koekemoer (INS) Close-up of a simulated star: F270W 4-point dither pattern: (1.0,0.5) (1.5,1.5) (0,0) (0.5,1.0) Includes detector-related readnoise, dark current and photon statistics Output drizzled image (lower 2 panels): – 1/2 the input pixel scale – two different greyscale stretches: • extended large-scale PSF • improved PSF core sampling 49 STScI TIPS/JIM 15 September 2005 Optimizing JWST Dither Strategies Anton Koekemoer (INS) 50 Analysis of Dithered Images Properties measured: Centroid and photometry of each star, using DAOphot FWHM of each star, using SExtractor Verification checks performed: measurements compared between input values, dithered exposures, and output drizzled images Metrics calculated: Astrometry: measured position of each star, relative to its input position: Photometry: measured count-rate of each star, relative to input values For both astrometry and photometry: – compare width of the resulting distribution with the theoretical width expected if the only sources of error were due to Poisson statistics, and not undersampling – Goal is to quantify additional error introduced by undersampling FWHM: measured for each star, compared with theoretical value expected STScI TIPS/JIM 15 September 2005 Optimizing JWST Dither Strategies Anton Koekemoer (INS) Astrometry: Comparison of x,y values 51 STScI TIPS/JIM 15 September 2005 Optimizing JWST Dither Strategies Anton Koekemoer (INS) Astrometry as a function of count-rate 52 STScI TIPS/JIM 15 September 2005 Optimizing JWST Dither Strategies Anton Koekemoer (INS) Photometry Comparison 53 STScI TIPS/JIM 15 September 2005 Optimizing JWST Dither Strategies Anton Koekemoer (INS) FWHM Comparison 54 STScI TIPS/JIM 15 September 2005 Optimizing JWST Dither Strategies Anton Koekemoer (INS) 55 Summary of Results Individual Dither Patterns / Filters: Produced a set of 35 sets of plots like the preceding ones, for each dither pattern and filter For each quantity (astrometry, photometry, FWHM), extracted one quantity: – Astrometry: dispersion of measured values, relative to theoretical dispersion expected if undersampling did not contribute any error – Photometry: dispersion of measured values, relative to theoretical dispersion expected if undersampling did not contribute any error – FWHM: Average width of bright stars, relative to theoretical FWHM for each filter All these quantities can be summarized on two plots: – short-wavelength filters F070W, F110W, F150W, F200W – long-wavelength filters F270W, F357W, F444W STScI TIPS/JIM 15 September 2005 Optimizing JWST Dither Strategies Anton Koekemoer (INS) NIRCam Short-Wavelength: Results 56 STScI TIPS/JIM 15 September 2005 Optimizing JWST Dither Strategies Anton Koekemoer (INS) NIRCam Long-Wavelength: Results 57 STScI TIPS/JIM 15 September 2005 Optimizing JWST Dither Strategies Anton Koekemoer (INS) 58 NIRCam Dither Patterns: Overall Results FWHM: significant improvement generally obtained from 2 to 3-point further improvement from 3 to 4-point, with near-optimal results 9-point pattern (1/3-pixel 3x3) does not yield significant further gains likely because 1/2-pixel 2x2 dither already provides Nyquist sampling Photometry: Improvements are more gradual than for FWHM; for several filters, optimal results are obtained only for the 9-point (1/3-pixel 3x3) pattern Most likely related to the fact that photometric fidelity is driven more by pixel-to-pixel effects Astrometry: Generally, optimal astrometry is only obtained with a 9-point dither pattern Likely related to a combination of pixel-to-pixel effects as well as Nyquist sampling STScI TIPS/JIM 15 September 2005 Optimizing JWST Dither Strategies Anton Koekemoer (INS) Overhead Time Evaluation Consider 3 types of program (following NIRCam OCD): short programs, representative of bright star surveys medium programs, eg moderately faint extragalactic programs long programs, aimed at deep imaging Scenario A: N dithers, cycle filters at each dither pattern Scenario B: N dithers, cycle filters only once 59 STScI TIPS/JIM 15 September 2005 Optimizing JWST Dither Strategies Anton Koekemoer (INS) Final Results: Cost/Benefit Metrics 60 STScI TIPS/JIM 15 September 2005 Optimizing JWST Dither Strategies Anton Koekemoer (INS) 61 Summary & Conclusions (NIRCam) For short programs: 9-point patterns are generally not optimal for 3- or 4-point patterns, infrequent filter changes are significantly more cost-effective for 2-point patterns, filters could be changed at each dither without too much penalty For medium programs: for 2,3,4-point patterns, overhead difference is less when changing filters at each dither point, so this might be desirable to produce more uniform data 9-point patterns are probably generally not worth the additional overhead For long programs: Relative cost increase for 9-point pattern is less, reaching a maximum of only 3% of total observing time, even when changing filters at each dither point, so this will likely be preferred in most cases STScI TIPS/JIM 15 September 2005 Optimizing JWST Dither Strategies Anton Koekemoer (INS) 62 Future Work NIRCam: include effects of intra-pixel sensitivity variations include geometric distortion, which produces different subsampling across chip Other instruments: FGS-TF: can adapt current code relatively easily, since detectors are the same MIRI imaging mode: code can be run with some modifications MIRI/IFU - study already conducted by A. Glasse, combining instrument design with dither pattern optimization MIRI/LRS - code will need work to adapt to spectroscopic observations NIRSpec: preliminary study by M. Regan Broadening the science applications: Include different galaxy types (exponential disks, r1/4 profiles, etc) Simulate galaxy luminosity functions and possible selection effects TIPS-JIM Meeting 15 September 2005, 10am, Auditorium 1. Update on TGM Performance Marco Sirianni 2. 3. HST Optical Behavior and Focus Status Optimizing JWST Dither Strategies Matt Lallo Anton Koekemoer Next TIPS Meeting will be held on 20 October 2005.
