Lake Tanganyika’s Demersal Fishery and Biology of a Species Abundant...
advertisement
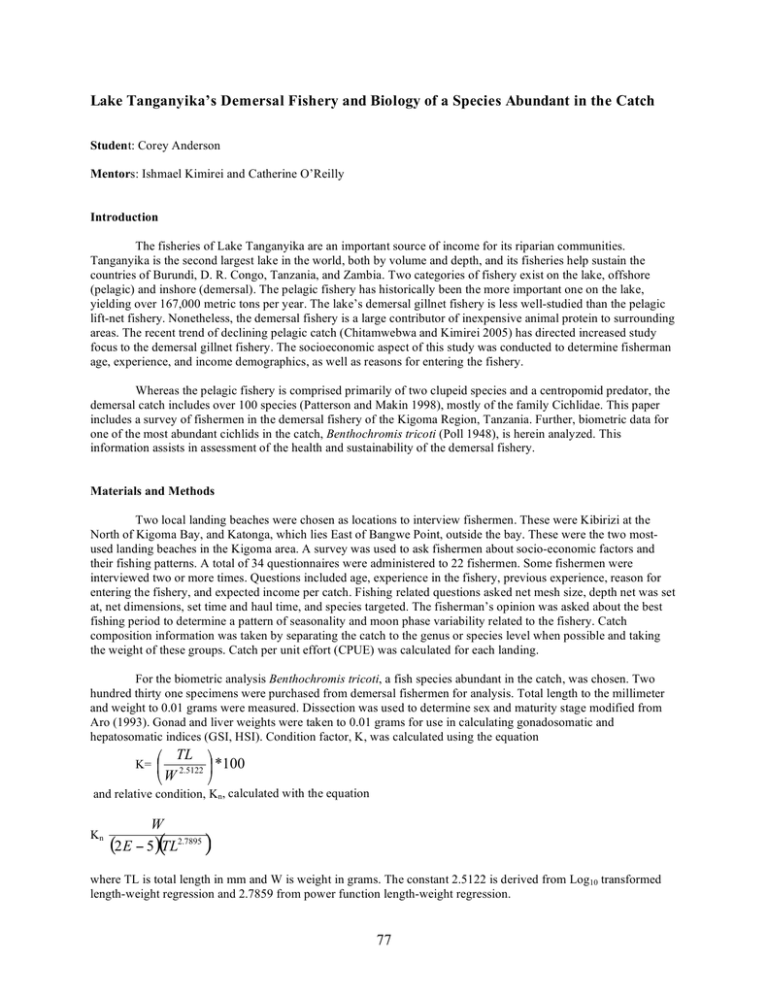
Lake Tanganyika’s Demersal Fishery and Biology of a Species Abundant in the Catch Student: Corey Anderson Mentors: Ishmael Kimirei and Catherine O’Reilly Introduction The fisheries of Lake Tanganyika are an important source of income for its riparian communities. Tanganyika is the second largest lake in the world, both by volume and depth, and its fisheries help sustain the countries of Burundi, D. R. Congo, Tanzania, and Zambia. Two categories of fishery exist on the lake, offshore (pelagic) and inshore (demersal). The pelagic fishery has historically been the more important one on the lake, yielding over 167,000 metric tons per year. The lake’s demersal gillnet fishery is less well-studied than the pelagic lift-net fishery. Nonetheless, the demersal fishery is a large contributor of inexpensive animal protein to surrounding areas. The recent trend of declining pelagic catch (Chitamwebwa and Kimirei 2005) has directed increased study focus to the demersal gillnet fishery. The socioeconomic aspect of this study was conducted to determine fisherman age, experience, and income demographics, as well as reasons for entering the fishery. Whereas the pelagic fishery is comprised primarily of two clupeid species and a centropomid predator, the demersal catch includes over 100 species (Patterson and Makin 1998), mostly of the family Cichlidae. This paper includes a survey of fishermen in the demersal fishery of the Kigoma Region, Tanzania. Further, biometric data for one of the most abundant cichlids in the catch, Benthochromis tricoti (Poll 1948), is herein analyzed. This information assists in assessment of the health and sustainability of the demersal fishery. Materials and Methods Two local landing beaches were chosen as locations to interview fishermen. These were Kibirizi at the North of Kigoma Bay, and Katonga, which lies East of Bangwe Point, outside the bay. These were the two mostused landing beaches in the Kigoma area. A survey was used to ask fishermen about socio-economic factors and their fishing patterns. A total of 34 questionnaires were administered to 22 fishermen. Some fishermen were interviewed two or more times. Questions included age, experience in the fishery, previous experience, reason for entering the fishery, and expected income per catch. Fishing related questions asked net mesh size, depth net was set at, net dimensions, set time and haul time, and species targeted. The fisherman’s opinion was asked about the best fishing period to determine a pattern of seasonality and moon phase variability related to the fishery. Catch composition information was taken by separating the catch to the genus or species level when possible and taking the weight of these groups. Catch per unit effort (CPUE) was calculated for each landing. For the biometric analysis Benthochromis tricoti, a fish species abundant in the catch, was chosen. Two hundred thirty one specimens were purchased from demersal fishermen for analysis. Total length to the millimeter and weight to 0.01 grams were measured. Dissection was used to determine sex and maturity stage modified from Aro (1993). Gonad and liver weights were taken to 0.01 grams for use in calculating gonadosomatic and hepatosomatic indices (GSI, HSI). Condition factor, K, was calculated using the equation K= TL 2.5122 *100 W and relative condition, Kn, calculated with the equation Kn W (2 E 5)TL2.7895 ( ) where TL is total length in mm and W is weight in grams. The constant 2.5122 is derived from Log10 transformed length-weight regression and 2.7859 from power function length-weight regression. 77 Results Expected daily incomes of fishermen ranged from 500 Tanzanian Shillings to 20,000 TSh per catch. There was no correlation between fishing experience with expected income, and the range given was often quite broad (between 4500 and 19,500 TSh). Fishermen stated that income varied between seasons and between moon phases. Moon phase during this study ranged of one cycle from new moon at the start (July 13, 2007) to full moon at the end (July 27, 2007). The most frequent reason given for entrance into the fishery was self-employment. Many of the interviewed fishermen also cited the “benefits” of the demersal fishery as their reason for entrance, but specific benefits were not listed. Fisherman age ranged from 19 to 40 years old, with a mean of 29. Fishing experience ranged from less than one year to 30 years (mean 10 years). Only two of the interviewees had previous experience in other fisheries, one from the pelagic sardine fishery and the other from line fishing. According to the fishermen interviewed, the wet season yields a better catch than the dry season. There is a discrepancy as to which moon phase has better fishing, however. Those that prefer to fish shallower (5 m – 20 m) said that the new moon yields more catch, while those who are willing to fish deeper (50 m – 200 m) stated that the full moon yields more. Many fishermen switched from fishing shallow during the new moon to fishing further offshore in deeper water during the full moon period. Shallow catch weight decreased over the study period while deep catch weight increased (Fig. 1). Catch weight and CPUE were positively correlated with increasing fishing depth (p< 0.005, r2 = 0.33; p< 0.005, r = 0.32 respectively). Number of species caught showed no significant correlation with fishing depth, as reported by Lowe (2006). 2 Benthochromis tricoti was more abundant in catches at the northern site, Kibirizi (n = 770), than at the southern site, Katonga (n = 161). This species was most often (95%) caught in 1.5 inch mesh gillnets set between 15 and 200 meters (mode 100 m) depth. Lengths of B. tricoti were normally distributed (Fig. 2) (mean 162 mm, SD 9.2, n = 231) and indicated 4+ year classes. Weights for combined sexes were also distributed normally (Fig. 3) (Mean 33.6 g, SD 6.59, n = 231). Mean weights between males (32.5 g, SD 6.83, n = 68) and females (34.5, SD 6.39, n = 153) were found to be significantly different (Table 1). Length–weight regression is given for combined sexes (Fig. 4). The sex ratio of sampled fish was 2.33 females per 1 male. Sixty-eight males were caught and 153 females, 10 fish were not differentiable. Calculated biometric indices are given in Table 2. A comparison of biometric data, including mean male weights and lengths, and combined sex weights, was made with that collected by Lowe et al. (2006) and significant differences from 2007 data are given in Table 1. Other comparisons of mean length, weight, hepatosomatic and gonadosomatic indices and condition and relative condition factors not significant are not herein listed. Discussion Because of the influence of climate change lowering primary productivity of the lake (O’Reilly et al. 2003, Verburg et al. 2003) the pelagic fishery is thought to be in decline (Chitamwebwa and Kimerei 2005). It was hypothesized that fishermen may be making a switch to the demersal fishery from the more cost-intensive (Lowe et al. 2006) pelagic sardine fishery. Only two fishermen had previous experience in another fishery, and only one was from the sardine fishery. However, as of this study there is not an influx of fishermen from the pelagic to the demersal fishery. It remains for future studies to determine any trend of migration. Benthochromis tricoti is only one of the major species caught by demersal fishermen. It is one of the more abundant deep-water cichlids, along with Bathybates spp. and Hemibates stenosoma. Because of the small size of B. tricoti (mean 162mm), it is only attractive as a local food fish and not suitable for export (i.e. dried sardines or frozen Nile perch from Lake Victoria). Nevertheless the study of this fish’s biology is important for fishery 78 management purposes (Coulter et al. 1965) because it is an important part of the catch and a contributor of inexpensive animal protein to the riparian communities. Although the demersal fishery is not very species selective, certain species can be targeted by using different mesh sizes and fishing at varying depths. At one point when specimens were needed, fishermen were asked to target B. tricoti. Few were landed, except by a single fisherman identified as having the “correct mesh size” by the other fishermen. Using 1.5-inch mesh he landed over 100 specimens of B. tricoti. Generally, species composition of the catch between 5-20m is quite different than that of 50-100m. This is because of physiological and niche differences in certain species restricting them to different areas of the lake. The shallow areas show a greater diversity of small cichlids and juvenile fish, while the deeper areas have lower diversity but greater biomass of catchable-sized fish. Fishing depth for deeper water species often exceeds the oxycline depth of 79 m observed by Hohoff (2007). This is likely due to the rudimentary method of gauging depth. A weighted line of predetermined length is lowered to the bottom, but it may be carried by currents and hang diagonally, misgauging actual depth. Net floats may hang slack in shallower water or hang diagonally if there is strong current. This may be very common in depths over 50 m. The maturity staging information, along with the minimum size of 133 mm, indicates that the catch of B. tricoti is composed mostly of sexually mature individuals. Because of the relatively small size of the gonads, however, accurate staging was difficult. Few immature or juvenile fish were harvested by the gillnet fishermen, attesting to the sustainability of the fishery for this species. Although the ratio of females to males is higher than that of Lowe et al. (2006), on the final sampling interview 689 Benthochromis tricoti were landed at Kibirizi, mostly mature males, which were not collected for the biometric analysis. One sampled female had three juveniles (size approx 20 mm) protruding from the mouth when collected. This is an indicator that at least part of the population has already spawned and is mouth brooding young by July. It is unknown if female fish tend to spit their young from the buccal cavity when caught in a gillnet. If so, this may account for the low occurrence of juveniles in the sample. The low amount of different sized eggs found in ripe females (9-30) also indicates that this species has either a protracted or year-round breeding season. Future studies should be conducted on the biology of Bathybates and Hemibates spp., Chrystichthys spp., and Afromastacembelus cunningtoni, as these fish can be most abundant in the deep-water demersal catch. Studies of Benthochromis migration and populations should be undertaken to determine how localized populations are. Genetic methods would seem to be the most effective methods for this, as a tagging study seems unfeasible in a lake of Tanganyika’s size. Future sampling studies should also be conducted over longer periods so that population dynamic parameters could be estimated for this species. At present the state of the demersal fishery appears stable. There is no major influx of fishermen from one fishery to another and the catch appears sustainable. Some fishermen explained that the catch was better in the past and that this could be due to heavier fishing pressure or increased population in the Kigoma area. This is a probable speculation as in developed countries nonpoint-source pollution from urban areas is known to have deleterious effects on fisheries. Generally the fishery around Kigoma supplies a good income for most fishermen and contributes significantly to the food source of riparian villages. Acknowledgements The author would like to thank Dr. Catherine O’Reilly and Ishmael Kimirei for their mentorship. Additionally Mbonde, A.S.E. is thanked for assistance with fieldwork. The Nyanza Project and TAFIRI are thanked for use of their resources. This work was financed by the Nyanza Project (NSF grant #s ATM 0223920 and DBI0608774). 79 References Aro, E. 1993. Guidelines for sampling pelagic fish catches on Lake Tanganyika. FAO/FINNIDA Research for the Management of the Fisheries on Lake Tanganyika. GCP/RAF/271/FIN-FM/04. Chitamwebwa, D.B.R., and I. A. Kimirei. 2005. Present fish catch at Kigoma, Tanzania. Verh. Internat. Verein. Limnol. 29:373-376. Hohoff, T. 2007. Climate change impacts on the biological parameters of the pelagic zone of Lake Tanganyika. Nyanza Project Annual Report. This Volume. Lowe, B., A. Kalangali, H. Mgana, I.A. Kimirei, and C.M. O’Reilly. 2006. Potential impact of the demersal fishery on Lake Tanganyika, Kigoma Tanzania. Nyanza Project Annual Report. O’Reilly, C.M., S.R. Alin, P.-D. Plisnier, A.S. Cohen, and B.A. McKee. 2003. Climate change decreases aquatic ecosystem productivity on Lake Tanganyika, Africa. Nature 424:766-768. Patterson, G. and J. Makin. 1998. The state of biodiversity in Lake Tanganyika – A literature review. Natural Resources Institute. Chatham, UK. Verburg, P. R.E. Hecky, and H. Kling. 2003. Ecological consequences of a century of warming in Lake Tanganyika. Science 301:505-507. Table 1. Comparison among July 2007 and between July 2006 and 2007 biometric data for Benthochromis tricoti from Kigoma area, Lake Tanganyika, Tanzania. Unpaired t-test with Welch’s correction. P values two-tailed, not assuming equal variances. $ indicates significant, ¥ very significant, £ extremely significant. Mean weight of males vs. females, 2007 Mean K of males vs. females, 2007 Mean TL of males, 2006 vs. 2007 Mean weight of males, 2006 vs. 2007 Mean weight of combined sexes, 2006 vs. 2007 P value t statistic df Significance 0.0447 2.029 121 $ 0.0084 2.696 89 ¥ 0.0004 3.649 109 £ 0.0494 1.986 112 $ <0.0001 4.224 502 £ Table 2. Mean biometric indices for Benthochromis tricoti caught in gillnets. Kigoma area, Lake Tanganyika, Tanzania. July 2007. GSI HSI K Kn Mean 0.1004 0.7801 2.77 1.143 SD 0.05802 0.33426 1.108 0.1265 80 n 211 219 231 231 y = -115.9x + 4100.4 R2 = 0.1366 3000 Catch Wt (g) Catch Wt (g) 4000 2000 1000 0 15 20 25 y = 780.86x - 12755 R2 = 0.2529 25000 20000 15000 10000 5000 0 30 15 20 25 30 Day of Month, July 2007 Day of Month, July 2007 Figure 1. Fish catch weight vs. day of month, for demersal fishery, Lake Tanganyika, Kigoma, Tanzania. July 2007. Shallow depths 5-20 m (left) and Deep depths 50-200 m (right). Moon phase was new on July 12 and full on July 28. Frequency 20 15 10 5 0 133 141 149 157 165 173 181 189 197 TL (mm) Frequency Figure 2. Length frequency distribution for Benthochromis tricoti caught in gillnets. Kigoma area, Lake Tanganyika, Tanzania. July 2007. 25 20 15 10 5 0 20 25 30 35 40 45 50 55 60 65 70 Weight (g) Figure 3. Weight frequency distribution for Benthochromis tricoti caught in gillnets. Kigoma area, Lake Tanganyika, Tanzania. July 2007. 81 1.9 1.8 Log10 Weight (g) 1.7 1.6 1.5 1.4 1.3 y = 2.5122x - 4.047 R2 = 0.4974 1.2 1.1 1 2.1 2.12 2.14 2.16 2.18 2.2 2.22 2.24 2.26 2.28 2.3 2.32 Log10 Length (mm) Figure 4. Length-weight regression for Benthochromis tricoti caught in gillnets. Kigoma area, Lake Tanganyika, Tanzania. July 2007. 82


