– 2011 Census - South ... City of Cape Town District August 2013
advertisement
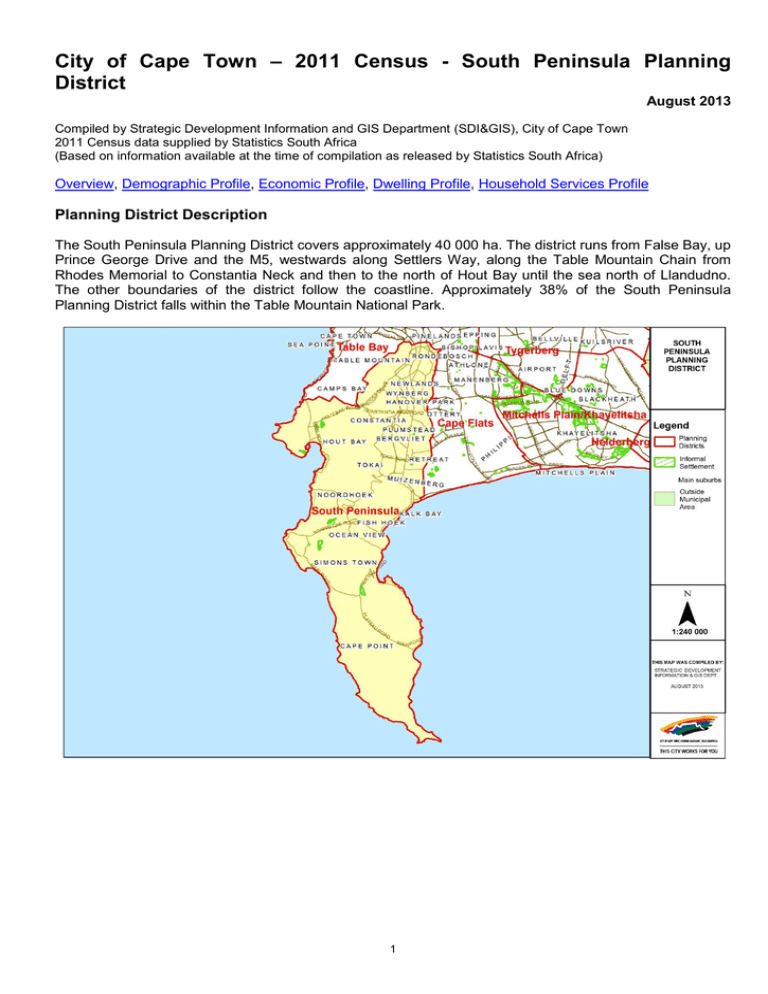
City of Cape Town – 2011 Census - South Peninsula Planning District August 2013 Compiled by Strategic Development Information and GIS Department (SDI&GIS), City of Cape Town 2011 Census data supplied by Statistics South Africa (Based on information available at the time of compilation as released by Statistics South Africa) Overview, Demographic Profile, Economic Profile, Dwelling Profile, Household Services Profile Planning District Description The South Peninsula Planning District covers approximately 40 000 ha. The district runs from False Bay, up Prince George Drive and the M5, westwards along Settlers Way, along the Table Mountain Chain from Rhodes Memorial to Constantia Neck and then to the north of Hout Bay until the sea north of Llandudno. The other boundaries of the district follow the coastline. Approximately 38% of the South Peninsula Planning District falls within the Table Mountain National Park. 1 Data Notes: The following databases from Statistics South Africa (SSA) software were used to extract the data for the profiles: Demographic Profile – Descriptive and Education databases Economic Profile – Labour Force and Head of Household databases Dwelling Profile – Dwellings database Household Services Profile – Household Services database Planning District Overview - 2011 Census South Peninsula Planning District Population Households Average Household Size Change 2001 to 2011 Number % 263 744 319 040 55 296 21.0% 86 567 106 671 20 104 23.2% 3.05 2.99 2001 2011 In 2011 the population of South Peninsula Planning District was 319 040 an increase of 21% since 2001, and the number of households was 20 104, an increase of 23% since 2001. The average household size has declined from 3.05 to 2.99 in the 10 years. A household is defined as a group of persons who live together, and provide themselves jointly with food or other essentials for living, or a single person who lives alone (Statistics South Africa). The population and household numbers above are to be used and quoted as the official numbers for this Planning District for 2011. Key results for South Peninsula Planning District: The population is predominantly White (40%), Coloured (31%) and Black African (24%). 66% of those aged 20 years and older have completed Grade 12 or higher. 88% of the labour force (aged 15 to 64) is employed. 30% of households have a monthly income of R3 200 or less. 87% of households live in formal dwellings. 93% of households have access to piped water in their dwelling or inside their yard. 94% of households have access to a flush toilet connected to the public sewer system. 97% of households have their refuse removed at least once a week. 98% of households use electricity for lighting in their dwelling. Note: There are small variations in the total population and the number of households in the tables which follow. These occur as Statistics South Africa had to calculate the true population to correct omissions and double counts in the enumeration process. In addition when the data is extracted using the Statistics South Africa software, it randomly rounds off all cells to a base number 3, including the totals. These variations are not significant. Go to top of document 2 Demographic Profile – 2011 Census South Peninsula Planning District Population Black African Num 40 554 12.7% 35 788 11.2% 76 342 23.9% Coloured 48 150 15.1% 51 005 16.0% 99 155 31.1% Asian 3 159 1.0% 3 150 1.0% 6 309 2.0% White 60 086 18.8% 66 825 20.9% 126 911 39.8% Other 5 579 1.7% 4 744 1.5% 10 323 3.2% Total 157 528 49.4% 161 512 50.6% 319 040 100.0% Male Male % Female % Num Total % Num % Female % 85+ 80 - 84 75 - 79 70 - 74 65 - 69 60 - 64 55 - 59 50 - 54 45 - 49 40 - 44 35 - 39 30 - 34 25 - 29 20 - 24 15 - 19 10 - 14 05 - 09 00 - 04 6 5 South Peninsula Planning District Age 0 to 4 years 4 3 2 1 0 1 2 % of Population Black African Num 3 4 Coloured % Num 5 6 Asian % Num White % Num Other % Num Total % Num % 7 521 9.9% 7 947 8.0% 336 5.3% 6 018 4.7% 888 8.6% 22 710 7.1% 5 to 14 years 8 775 11.5% 14 415 14.5% 717 11.4% 12 627 9.9% 1 251 12.1% 37 785 11.8% 15 to 24 years 17 943 23.5% 17 466 17.6% 1 581 25.1% 17 106 13.5% 1 830 17.7% 55 926 17.5% 25 to 64 years 39 852 52.2% 51 690 52.1% 3 354 53.2% 68 781 54.2% 5 502 53.3% 169 179 53.0% 65 years and older 2 244 2.9% 7 632 7.7% 318 5.0% 22 374 17.6% 855 8.3% 33 423 10.5% Total 76 335 100.0% South Peninsula Planning District Adult Education (for all aged 20+) 99 150 100.0% Black African Num % Coloured Num % 6 306 100.0% 126 906 100.0% 10 326 100.0% Asian Num White % Num Other % Num 319 023 100.0% Total % Num % No schooling 1 023 2.2% 1 254 1.9% 36 0.8% 207 0.2% 165 2.2% 2 685 1.2% Some primary 3 159 6.9% 5 469 8.5% 90 2.0% 615 0.6% 258 3.5% 9 591 4.4% 3.3% 1.4% 2.0% Completed primary 3 567 5.5% 60 357 0.4% 150 5 658 2.6% Some secondary 16 038 34.8% 24 828 38.5% 504 11.4% 10 860 11.1% 1 746 23.8% 53 976 24.5% Grade 12 14 994 32.5% 18 507 28.7% 1 302 29.5% 30 192 30.9% 2 307 31.4% 67 302 30.6% 9 051 19.6% 10 620 16.5% 2 367 53.7% 54 015 55.2% 2 625 35.7% 78 678 35.7% 0.4% 51 1.6% 99 Higher 1 524 Other Total 279 0.6% 276 46 068 100.0% 64 521 100.0% 1.2% 1 599 4 410 100.0% 97 845 100.0% Go to top of document 3 1.3% 2 304 1.0% 7 350 100.0% 220 194 100.0% Economic Profile – 2011 Census South Peninsula Planning District Labour Force Indicators Population aged 15 to 64 years Black African Coloured Asian White Other Total 57 798 69 159 4 932 85 890 7 326 225 105 Labour Force Employed Unemployed 37 371 43 428 2 997 61 143 5 151 150 090 28 353 9 018 36 894 6 534 2 820 177 58 800 2 343 4 503 648 131 370 18 720 Not Economically Active Discouraged Work-seekers Other not economically active 20 427 909 19 518 25 731 1 572 24 159 1 935 36 1 899 24 747 405 24 342 2 175 93 2 082 75 015 3 015 72 000 Rates % Unemployment rate Labour absorption rate Labour Force participation rate 24.13% 49.06% 64.66% 15.05% 53.35% 62.79% 5.91% 57.18% 60.77% 3.83% 68.46% 71.19% 12.58% 61.47% 70.31% 12.47% 58.36% 66.68% Definitions: Unemployment rate is the proportion of the labour force that is unemployed. The labour absorption rate is the proportion of working age (15 to 64 years) population that is employed. The labour force participation rate is the proportion of the working age population that is either employed or unemployed. South Peninsula Planning District Monthly Household Income No income Black African Num % Coloured Num % 4 716 19.5% 2 828 11.4% R 1 - R 1 600 4 633 19.2% 2 923 R 1 601 - R 3 200 5 011 20.7% 2 952 R 3 201 - R 6 400 3 510 14.5% R 6 401 - R 12 800 2 442 R 12 801 - R 25 600 1 955 R 25 601 - R 51 200 Asian Num White % Num Other % Num Total % Num % 278 13.3% 4 524 8.6% 420 14.5% 12 766 11.7% 75 3.6% 1 446 2.7% 411 14.2% 9 488 8.9% 11.9% 104 5.0% 1 585 3.0% 367 12.7% 10 019 9.4% 3 732 15.0% 143 6.8% 3 874 7.4% 372 12.9% 11 631 10.9% 10.1% 4 171 16.8% 252 12.1% 7 749 14.7% 367 12.7% 14 981 14.0% 8.1% 4 007 16.1% 432 20.7% 11 131 21.2% 376 13.0% 17 901 16.8% 1 204 5.0% 2 875 11.5% 429 20.5% 11 674 22.2% 318 11.0% 16 500 15.5% R 51 201 - R 102 400 464 1.9% 1 076 4.3% 251 12.0% 7 390 14.0% 170 5.9% 9 351 8.8% R 102 401 or more 253 1.0% 332 1.3% 126 6.0% 3 221 6.1% 93 3.2% 4 025 3.8% 1 0.0% 0 0.0% 1 0.0% 10 0.0% 0 0.0% 12 0.0% Unspecified Total 24 189 100.0% 24 896 100.0% 2 091 100.0% 52 604 100.0% Go to top of document 4 12.0% 2 894 100.0% 106 674 100.0% Dwelling Profile – 2011 Census South Peninsula Planning District Type of Dwelling Black African Formal Dwelling 13 778 57.0% 23 197 93.2% 2 047 98.0% 52 064 99.0% 2 137 73.8% 93 223 87.4% Informal dwelling / shack in backyard 3 920 16.2% 847 3.4% 13 0.6% 79 0.2% 474 16.4% 5 333 5.0% Informal dwelling / shack NOT in backyard 6 256 25.9% 408 1.6% 14 0.7% 63 0.1% 255 8.8% 6 996 6.6% 236 1.0% 442 1.8% 15 0.7% 399 0.8% 28 1.0% 1 120 1.0% Other Num % Total 24 190 100.0% South Peninsula Planning District Tenure Status Black African Num % Coloured Num % 24 894 100.0% Coloured Num % Asian Num White % 2 089 100.0% Asian Num Num Other % 52 605 100.0% White % Num Num Total % % 2 894 100.0% 106 672 100.0% Other % Num Num Total % Num % Owned and fully paid off 3 808 15.7% 8 008 32.2% 448 21.5% 20 859 39.7% 568 19.6% 33 691 31.6% Owned but not yet paid off 1 780 7.4% 6 466 26.0% 613 29.4% 16 522 31.4% 540 18.7% 25 921 24.3% 12 669 52.4% 8 973 36.0% 958 45.9% 13 688 26.0% 1 549 53.5% 37 837 35.5% 5 046 20.9% 880 3.5% 45 2.2% 849 1.6% 162 5.6% 6 982 6.5% 886 3.7% 569 2.3% 23 1.1% 687 1.3% 74 2.6% 2 239 2.1% Rented Occupied rent-free Other Total 24 189 100.0% 24 896 100.0% 2 087 100.0% Go to top of document 5 52 605 100.0% 2 893 100.0% 106 670 100.0% Household Services Profile – 2011 Census South Peninsula Planning District Access to Piped Water Piped water inside dwelling Black African Num 13 341 % Coloured Num 55.1% 23 796 % Asian Num White % 95.6% 2 046 Num Other % 98.0% 52 281 Num Total % 99.4% 2 202 Num 76.1% 93 666 % 87.8% Piped water inside yard 4 779 19.8% 606 2.4% 21 1.0% 156 0.3% 420 14.5% 5 982 5.6% Piped water outside yard: < 200m 4 350 18.0% 171 0.7% 12 0.6% 36 0.1% 189 6.5% 4 758 4.5% Piped water outside yard: > 200m 1 350 5.6% 60 0.2% 3 0.1% 39 0.1% 72 2.5% 1 524 1.4% No access to piped water 375 1.5% 264 1.1% 6 0.3% 96 0.2% 12 0.4% 753 0.7% Total South Peninsula Planning District Toilet Facility Flush toilet (connected to sewerage system) Flush toilet (with septic tank) 24 195 100.0% 24 897 100.0% Black African Num 20 622 % Coloured Num 85.3% 23 742 % 2 088 100.0% 52 608 100.0% Asian Num White % 95.4% 2 058 Num Other % 98.7% 51 447 2 895 100.0% 106 683 100.0% Num Total % 97.8% 2 796 Num 96.7% 100 665 % 94.4% 792 3.3% 120 0.5% 18 0.9% 978 1.9% 45 1.6% 1 953 1.8% 21 0.1% 18 0.1% 0 0.0% 24 0.0% 3 0.1% 66 0.1% 66 0.3% 24 0.1% 0 0.0% 21 0.0% 3 0.1% 114 0.1% 108 0.4% 39 0.2% 3 0.1% 9 0.0% 3 0.1% 162 0.2% 387 1.6% 285 1.1% 0 0.0% 15 0.0% 6 0.2% 693 0.6% Other 183 0.8% 378 1.5% 3 0.1% 45 0.1% 18 0.6% 627 0.6% None 2 010 8.3% 288 1.2% 3 0.1% 63 0.1% 18 0.6% 2 382 2.2% Chemical toilet Pit toilet with ventilation (VIP) Pit toilet without ventilation Bucket toilet Total South Peninsula Planning District Refuse Disposal Removed by local authority/private company at least once a week Removed by local authority/private company less often Communal refuse dump Own refuse dump 24 189 100.0% 24 894 100.0% Black African Num 21 645 Num 89.5% 24 582 % Asian Num White % 98.7% 2 058 Num 98.4% 52 188 2 892 100.0% 106 662 100.0% Other % Num Total % 99.2% 2 769 Num 95.7% 103 242 % 96.8% 165 0.7% 66 0.3% 12 0.6% 231 0.4% 21 0.7% 495 0.5% 1 083 4.5% 93 0.4% 12 0.6% 84 0.2% 15 0.5% 1 287 1.2% 1 233 5.1% 51 0.2% 6 0.3% 27 0.1% 78 2.7% 1 395 1.3% 30 0.1% 24 0.1% 0 0.0% 12 0.0% 3 0.1% 69 0.1% 36 0.1% 81 0.3% 3 0.1% 63 0.1% 6 0.2% 189 0.2% No rubbish disposal Other Total % Coloured 2 085 100.0% 52 602 100.0% 24 192 100.0% 24 897 100.0% 2 091 100.0% 52 605 100.0% Go to top of document 6 2 892 100.0% 106 677 100.0% Household Services Profile continued – 2011 Census South Peninsula Planning District Energy used for Lighting Electricity Black African Num % Coloured Num % Asian Num White % Num Other % Num Total % Num 22 554 93.2% 24 681 99.1% 2 082 99.6% 52 350 99.5% 2 862 66 0.3% 33 0.1% 6 0.3% 99 0.2% 6 0.2% 210 0.2% Paraffin 1 029 4.3% 42 0.2% 0 0.0% 15 0.0% 9 0.3% 1 095 1.0% Candles 453 1.9% 45 0.2% 3 0.1% 15 0.0% 6 0.2% 522 0.5% 39 0.2% 39 0.2% 0 0.0% 84 0.2% 6 0.2% 168 0.2% 51 0.2% 54 0.2% 0 0.0% 42 0.1% 3 0.1% 150 0.1% Gas Solar None Total South Peninsula Planning District Energy used for Cooking Electricity Gas 24 192 100.0% Black African Num % 24 894 100.0% Coloured Num % 2 091 100.0% Asian Num 52 605 100.0% White % Num 99.0% 104 529 % 2 892 100.0% 106 674 100.0% Other % 98.0% Num Total % Num % 21 564 89.1% 22 704 91.2% 1 692 81.0% 42 561 80.9% 2 511 86.9% 91 032 85.3% 816 3.4% 1 890 7.6% 369 17.7% 9 576 18.2% 333 11.5% 12 984 12.2% 1 458 6.0% 39 0.2% 0 0.0% 42 0.1% 18 0.6% 1 557 1.5% Wood 27 0.1% 36 0.1% 3 0.1% 33 0.1% 3 0.1% 102 0.1% Coal 18 0.1% 3 0.0% 0 0.0% 18 0.0% 0 0.0% 39 0.0% 9 0.0% 0 0.0% 0 0.0% 15 0.0% 0 0.0% 24 0.0% Solar 39 0.2% 30 0.1% 3 0.1% 72 0.1% 3 0.1% 147 0.1% Other 192 0.8% 108 0.4% 18 0.9% 234 0.4% 12 0.4% 564 0.5% None 66 0.3% 81 0.1% 3 0.1% 51 0.1% 9 0.3% 210 0.2% Paraffin Animal dung Total South Peninsula Planning District Energy used for Heating Electricity Gas Paraffin 24 189 100.0% Black African Num % 24 891 100.0% Coloured Num % 2 088 100.0% Asian Num 52 602 100.0% White % Num 2 889 100.0% 106 659 100.0% Other % Num Total % Num % 15 744 65.1% 19 935 80.1% 1 725 82.6% 39 318 74.7% 2 004 69.3% 78 726 73.8% 660 2.7% 684 2.7% 147 7.0% 5 271 10.0% 165 5.7% 6 927 6.5% 2 727 11.3% 66 0.3% 6 0.3% 84 0.2% 114 3.9% 2 997 2.8% Wood 492 2.0% 513 2.1% 66 3.2% 3 849 7.3% 111 3.8% 5 031 4.7% Coal 24 0.1% 18 0.1% 3 0.1% 216 0.4% 9 0.3% 270 0.3% Animal dung 6 0.0% 21 0.1% 0 0.0% 36 0.1% 0 0.0% 63 0.1% Solar 60 0.2% 84 0.3% 15 0.7% 654 1.2% 21 0.7% 834 0.8% Other 3 0.0% 3 0.0% 0 0.0% 9 0.0% 0 0.0% 15 0.0% 4 470 18.5% 3 573 14.4% 126 6.0% 3 171 6.0% 468 16.2% 11 808 11.1% None Total 24 186 100.0% 24 897 100.0% 2 088 100.0% Go to top of document 7 52 608 100.0% 2 892 100.0% 106 671 100.0%
