– 2011 Census – Eastern Health District City of Cape Town
advertisement
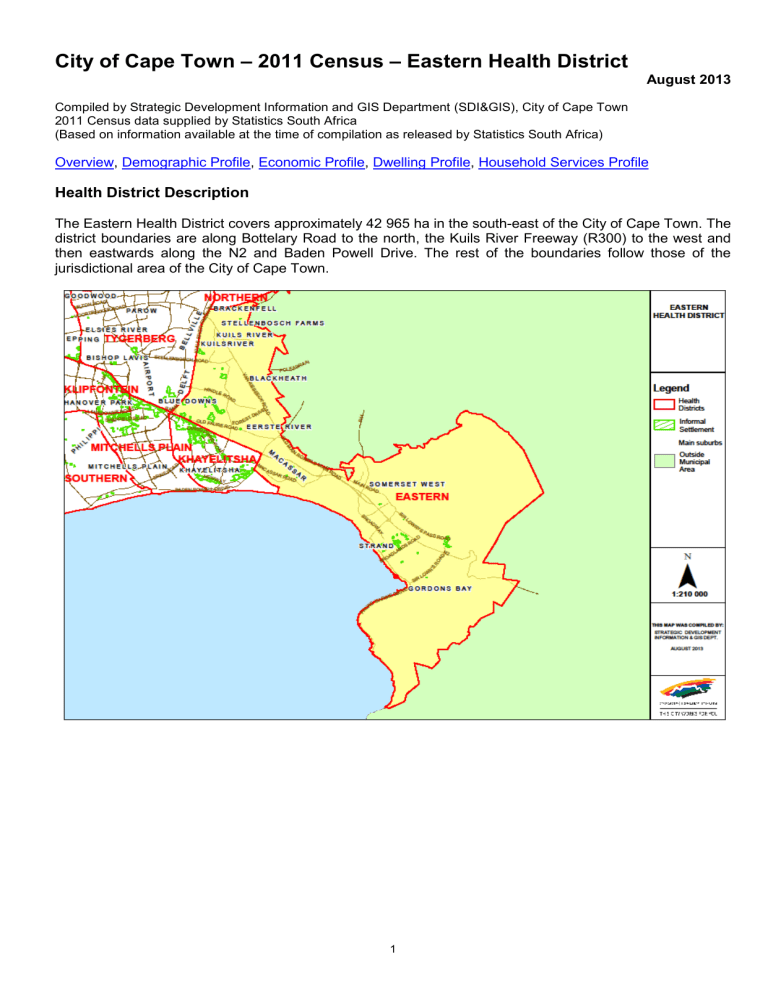
City of Cape Town – 2011 Census – Eastern Health District August 2013 Compiled by Strategic Development Information and GIS Department (SDI&GIS), City of Cape Town 2011 Census data supplied by Statistics South Africa (Based on information available at the time of compilation as released by Statistics South Africa) Overview, Demographic Profile, Economic Profile, Dwelling Profile, Household Services Profile Health District Description The Eastern Health District covers approximately 42 965 ha in the south-east of the City of Cape Town. The district boundaries are along Bottelary Road to the north, the Kuils River Freeway (R300) to the west and then eastwards along the N2 and Baden Powell Drive. The rest of the boundaries follow those of the jurisdictional area of the City of Cape Town. 1 Data Notes: The following databases from Statistics South Africa (SSA) software were used to extract the data for the profiles: Demographic Profile – Descriptive and Education databases Economic Profile – Labour Force and Head of Household databases Dwelling Profile – Dwellings database Household Services Profile – Household Services database Health District Overview – 2011 Census Change 2001 to 2011 Number % Population 338 017 508 689 170 672 50.5% Households 93 065 144 468 51 403 55.2% Average Household Size 3.63 3.52 Eastern Health District 2001 2011 In 2011 the population of Eastern Health District was 508 689 an increase of 51% since 2001, and the number of households was 144 468, an increase of 55% since 2001. The average household size has declined from 3.63 to 3.52 in the 10 years. A household is defined as a group of persons who live together, and provide themselves jointly with food or other essentials for living, or a single person who lives alone (Statistics South Africa). The population and household numbers above are to be used and quoted as the official numbers for this Health District for 2011. Key results for Eastern Health District: The population is predominantly Coloured (47%) and Black African (35%). 47% of those aged 20 years and older have completed Grade 12 or higher. 78% of the labour force (aged 15 to 64) is employed. 46% of households have a monthly income of R3 200 or less. 82% of households live in formal dwellings. 93% of households have access to piped water in their dwelling or inside their yard. 92% of households have access to a flush toilet connected to the public sewer system. 96% of households have their refuse removed at least once a week. 96% of households use electricity for lighting in their dwelling. Note: There are small variations in the total population and the number of households in the tables which follow. These occur as Statistics South Africa had to calculate the true population to correct omissions and double counts in the enumeration process. In addition when the data is extracted using the Statistics South Africa software, it randomly rounds off all cells to a base number 3, including the totals. These variations are not significant. Go to top of document 2 Demographic Profile – 2011 Census Eastern Health District Population Black African Male Female Num Num % 90 654 17.8% 85 964 16.9% 176 618 34.7% 115 259 22.7% 124 958 24.6% 240 217 47.2% Asian 1 524 0.3% 1 426 0.3% 2 950 0.6% White 38 160 7.5% 42 334 8.3% 80 494 15.8% Other 5 238 1.0% 3 172 0.6% 8 410 1.7% Total 250 835 49.3% 257 854 50.7% 508 689 100.0% Coloured Age in years Male % % Num Total % Female % 85+ 80 - 84 75 - 79 70 - 74 65 - 69 60 - 64 55 - 59 50 - 54 45 - 49 40 - 44 35 - 39 30 - 34 25 - 29 20 - 24 15 - 19 10 - 14 05 - 09 00 - 04 6 Eastern Health District Age 5 4 3 2 1 0 1 2 % of Population Black African Num % 3 Coloured Num 4 5 6 Asian % Num White % Num Other % % Num % 829 9.9% 53 352 10.5% 0 to 4 years 23 151 13.1% 25 067 10.4% 267 9.1% 4 038 5 to 14 years 28 248 16.0% 42 335 17.6% 444 15.1% 7 880 9.8% 925 11.0% 79 832 15.7% 15 to 24 years 34 136 19.3% 44 999 18.7% 552 18.7% 8 984 11.2% 1 735 20.6% 90 406 17.8% 25 to 64 years 88 144 49.9% 119 164 49.6% 1 566 53.1% 43 834 54.5% 4 581 54.5% 257 289 50.6% 121 4.1% 15 758 19.6% 65 years and older Total Eastern Health District Adult Education (for all aged 20+) No schooling Some primary Completed primary 2 940 1.7% 8 653 3.6% 176 619 100.0% 240 218 100.0% Black African Num 2 601 10 887 5 130 % 2.4% Coloured Num % 5.0% Num Total 2 950 100.0% 80 494 100.0% Asian White Num % Num 340 4.0% Other % 27 812 5.5% 8 410 100.0% 508 691 100.0% Num Total % Num % 2 817 1.9% 42 2.2% 123 0.2% 324 5.4% 5 907 1.8% 10.0% 16 206 4.7% 10.9% 120 6.4% 492 0.8% 366 6.1% 28 071 8.6% 9 120 6.1% 51 2.7% 252 0.4% 216 3.6% 14 769 4.5% Some secondary 49 290 45.3% 62 742 42.1% 528 28.1% 8 622 14.0% 2 073 34.3% 123 255 37.7% Grade 12 31 470 28.9% 42 219 28.3% 609 32.4% 23 022 37.5% 2 007 33.2% 99 327 30.4% 8 973 8.3% 15 189 10.2% 507 27.0% 28 017 45.6% 933 15.4% 53 619 16.4% 0.5% 21 1.5% 129 Higher Other Total 360 0.3% 717 108 711 100.0% 149 010 100.0% 1.1% 918 1 878 100.0% 61 446 100.0% Go to top of document 3 2.1% 2 145 0.7% 6 048 100.0% 327 093 100.0% Economic Profile – 2011 Census Eastern Health District Labour Force Indicators Black African Population aged 15 to 64 years Coloured Asian White Other Total 122 280 164 163 2 115 52 824 6 315 347 697 Labour Force Employed Unemployed 85 371 57 273 28 098 106 353 84 708 21 645 1 338 1 161 177 37 911 35 754 2 157 4 743 3 939 804 235 716 182 835 52 881 Not Economically Active Discouraged Work-seekers Other not economically active 36 909 5 349 31 560 57 810 4 971 52 839 777 39 738 14 913 381 14 532 1 572 147 1 425 111 981 10 887 101 094 Rates % Unemployment rate Labour absorption rate Labour Force participation rate 32.91% 46.84% 69.82% 20.35% 51.60% 64.79% 13.23% 54.89% 63.26% 5.69% 67.69% 71.77% 16.95% 62.38% 75.11% 22.43% 52.58% 67.79% Definitions: Unemployment rate is the proportion of the labour force that is unemployed. The labour absorption rate is the proportion of working age (15 to 64 years) population that is employed. The labour force participation rate is the proportion of the working age population that is either employed or unemployed. Eastern Health District Monthly Household Income No income 10 173 18.5% 6 006 10.9% 93 12.2% 2 964 9.5% 330 15.2% 19 566 13.5% R 1 - R 1 600 14 919 27.2% 7 269 13.1% 60 7.8% 957 3.1% 390 18.0% 23 595 16.3% R 1 601 - R 3 200 12 861 23.4% 8 232 14.9% 72 9.4% 1 242 4.0% 438 20.2% 22 845 15.8% R 3 201 - R 6 400 7 965 14.5% 9 999 18.1% 105 13.7% 3 018 9.6% 357 16.4% 21 444 14.8% R 6 401 - R 12 800 4 305 7.8% 9 822 17.7% 141 18.4% 5 676 18.1% 261 12.0% 20 205 14.0% R 12 801 - R 25 600 2 736 5.0% 8 085 14.6% 135 17.6% 7 425 23.7% 192 8.8% 18 573 12.9% R 25 601 - R 51 200 Black African Num % Coloured Num % Asian Num White % Num Other % Num Total % Num % 1 413 2.6% 4 497 8.1% 108 14.1% 6 282 20.1% 150 6.9% 12 450 8.6% R 51 201 - R 102 400 333 0.6% 1 077 1.9% 36 4.7% 2 658 8.5% 42 1.9% 4 146 2.9% R 102 401 or more 156 0.3% 348 0.6% 15 2.0% 1 080 3.4% 12 0.6% 1 611 1.1% 3 0.0% 6 0.0% 0 0.0% 9 0.0% 0 0.0% 18 0.0% Unspecified Total 54 864 100.0% 55 341 100.0% 765 100.0% 31 311 100.0% Go to top of document 4 2 172 100.0% 144 453 100.0% Dwelling Profile – 2011 Census Eastern Health District Type of Dwelling Black African Formal Dwelling 34 328 62.6% 50 036 90.4% 716 93.7% 30 976 98.9% 1 748 Informal dwelling / shack in backyard 8 235 15.0% 3 210 5.8% 19 2.5% 53 0.2% 319 14.6% 11 836 8.2% Informal dwelling / shack NOT in backyard 11 737 21.4% 1 271 2.3% 7 0.9% 47 0.2% 49 2.2% 13 111 9.1% 574 1.0% 826 1.5% 22 2.9% 231 0.7% 64 2.9% 1 717 1.2% Other Total Eastern Health District Tenure Status Owned and fully paid off Num % 54 874 100.0% Black African Num % Coloured Num % 55 343 100.0% Coloured Num % Asian Num White % 764 100.0% Asian Num Num Other % 31 307 100.0% White % Num Num Total % 80.2% 117 804 % 81.5% 2 180 100.0% 144 468 100.0% Other % Num Num Total % Num % 15 816 28.8% 19 248 34.8% 145 19.0% 11 327 36.2% 346 15.9% 46 882 32.5% 5 638 10.3% 17 554 31.7% 236 30.9% 8 868 28.3% 314 14.4% 32 610 22.6% Rented 16 368 29.8% 13 619 24.6% 334 43.8% 10 151 32.4% 1 383 63.5% 41 855 29.0% Occupied rent-free 14 728 26.8% 3 562 6.4% 38 5.0% 617 2.0% 88 4.0% 19 033 13.2% 2 324 4.2% 1 358 2.5% 10 1.3% 345 1.1% 48 2.2% 4 085 2.8% Owned but not yet paid off Other Total 54 874 100.0% 55 341 100.0% 763 100.0% Go to top of document 5 31 308 100.0% 2 179 100.0% 144 465 100.0% Household Services Profile – 2011 Census Eastern Health District Access to Piped Water Piped water inside dwelling Black African Num % Coloured Num % Asian Num White % 29 892 54.5% 48 216 87.1% 714 16 062 29.3% 5 517 10.0% 36 4.7% Piped water outside yard: < 200m 6 972 12.7% 987 1.8% 9 Piped water outside yard: > 200m 1 386 2.5% 210 0.4% No access to piped water 570 1.0% 411 0.7% Piped water inside yard Total Eastern Health District Toilet Facility Flush toilet (connected to sewerage system) Flush toilet (with septic tank) Chemical toilet Pit toilet with ventilation (VIP) Pit toilet without ventilation Bucket toilet 54 882 100.0% 55 341 100.0% Black African Num 48 855 Total Eastern Health District Refuse Disposal Removed by local authority/private company at least once a week Removed by local authority/private company less often Communal refuse dump Num 89.0% 51 150 % % 93.7% 30 927 Num Total % Num % 98.8% 1 665 76.3% 111 414 77.1% 189 0.6% 435 19.9% 22 239 15.4% 1.2% 39 0.1% 48 2.2% 8 055 5.6% 3 0.4% 63 0.2% 9 0.4% 1 671 1.2% 0 0.0% 84 0.3% 24 1.1% 1 089 0.8% 762 100.0% 31 302 100.0% Asian Num White % 92.4% 729 Num Other % 95.3% 30 753 2 181 100.0% 144 468 100.0% Num Total % 98.2% 2 031 Num 93.1% 133 518 % 92.4% 837 1.5% 936 1.7% 18 2.4% 432 1.4% 48 2.2% 2 271 1.6% 1 449 2.6% 132 0.2% 3 0.4% 15 0.0% 15 0.7% 1 614 1.1% 54 0.1% 66 0.1% 0 0.0% 21 0.1% 6 0.3% 147 0.1% 51 0.1% 63 0.1% 0 0.0% 6 0.0% 6 0.3% 126 0.1% 1 620 3.0% 1 395 2.5% 6 0.8% 24 0.1% 21 1.0% 3 066 2.1% 402 0.7% 588 1.1% 3 0.4% 36 0.1% 27 1.2% 1 056 0.7% 1 605 2.9% 1 011 1.8% 6 0.8% 24 0.1% 27 1.2% 2 673 1.9% Other None % Coloured Num Other 54 873 100.0% 55 341 100.0% Black African Num 51 093 % Coloured Num 93.1% 54 219 % 765 100.0% 31 311 100.0% Asian Num White % 98.0% 741 Num 96.9% 30 930 2 181 100.0% 144 471 100.0% Other % Num Total % 98.8% 2 079 Num 95.5% 139 062 % 96.3% 654 1.2% 207 0.4% 9 1.2% 141 0.5% 54 2.5% 1 065 0.7% 1 863 3.4% 378 0.7% 3 0.4% 78 0.2% 12 0.6% 2 334 1.6% Own refuse dump 840 1.5% 264 0.5% 6 0.8% 87 0.3% 24 1.1% 1 221 0.8% No rubbish disposal 315 0.6% 177 0.3% 3 0.4% 30 0.1% 3 0.1% 528 0.4% Other 111 0.2% 93 0.2% 3 0.4% 42 0.1% 6 0.3% 255 0.2% Total 54 876 100.0% 55 338 100.0% 765 100.0% 31 308 100.0% Go to top of document 6 2 178 100.0% 144 465 100.0% Household Services Profile continued – 2011 Census Eastern Health District Energy used for Lighting Electricity Black African Num % Coloured Num % Asian Num White % Num Other % Num Total % Num % 49 719 90.6% 54 465 98.4% 753 98.4% 31 125 99.4% 2 157 174 0.3% 93 0.2% 3 0.4% 36 0.1% 3 0.1% 309 0.2% Paraffin 3 345 6.1% 84 0.2% 3 0.4% 18 0.1% 0 0.0% 3 450 2.4% Candles 1 422 2.6% 423 0.8% 3 0.4% 15 0.0% 9 0.4% 1 872 1.3% 99 0.2% 114 0.2% 3 0.4% 75 0.2% 3 0.1% 294 0.2% 114 0.2% 162 0.3% 0 0.0% 42 0.1% 6 0.3% 324 0.2% Gas Solar None Total Eastern Health District Energy used for Cooking Electricity 54 873 100.0% Black African Num % 55 341 100.0% Coloured Num % 765 100.0% Asian Num 31 311 100.0% White % Num 99.0% 138 219 2 178 100.0% 144 468 100.0% Other % 95.7% Num Total % Num % 48 369 88.1% 53 400 96.5% 675 88.9% 26 475 84.5% 2 037 Gas 2 562 4.7% 1 251 2.3% 78 10.3% 4 563 14.6% 114 5.2% 8 568 5.9% Paraffin 3 480 6.3% 129 0.2% 3 0.4% 18 0.1% 9 0.4% 3 639 2.5% Wood 141 0.3% 213 0.4% 0 0.0% 24 0.1% 3 0.1% 381 0.3% Coal 21 0.0% 21 0.0% 0 0.0% 6 0.0% 0 0.0% 48 0.0% Animal dung 21 0.0% 30 0.1% 0 0.0% 12 0.0% 0 0.0% 63 0.0% 102 0.2% 84 0.2% 3 0.4% 54 0.2% 6 0.3% 249 0.2% Other 57 0.1% 39 0.1% 0 0.0% 126 0.4% 9 0.4% 231 0.2% None 123 0.2% 177 0.4% 0 0.0% 36 0.1% 3 0.1% 339 0.2% Solar Total Eastern Health District Energy used for Heating Electricity 54 876 100.0% Black African Num % 55 344 100.0% Coloured Num % 759 100.0% Asian Num 31 314 100.0% White % Num 93.4% 130 956 2 181 100.0% 144 474 100.0% Other % 90.6% Num Total % Num % 24 741 45.1% 45 786 82.7% 603 79.1% 23 898 76.3% 1 461 67.1% 96 489 66.8% 1 590 2.9% 573 1.0% 30 3.9% 2 277 7.3% 57 2.6% 4 527 3.1% 13 434 24.5% 288 0.5% 9 1.2% 75 0.2% 96 4.4% 13 902 9.6% Wood 858 1.6% 1 125 2.0% 21 2.8% 1 797 5.7% 42 1.9% 3 843 2.7% Coal 114 0.2% 69 0.1% 3 0.4% 45 0.1% 0 0.0% 231 0.2% Animal dung 27 0.0% 45 0.1% 0 0.0% 24 0.1% 3 0.1% 99 0.1% Solar 93 0.2% 162 0.3% 0 0.0% 285 0.9% 15 0.7% 555 0.4% Gas Paraffin Other 3 0.0% 3 0.0% 0 0.0% 3 0.0% 0 0.0% 9 0.0% None 14 013 25.5% 7 290 13.2% 96 12.6% 2 898 9.3% 504 23.1% 24 801 17.2% Total 54 873 100.0% 55 341 100.0% 762 100.0% Go to top of document 7 31 302 100.0% 2 178 100.0% 144 456 100.0%
