Document 10518349
advertisement
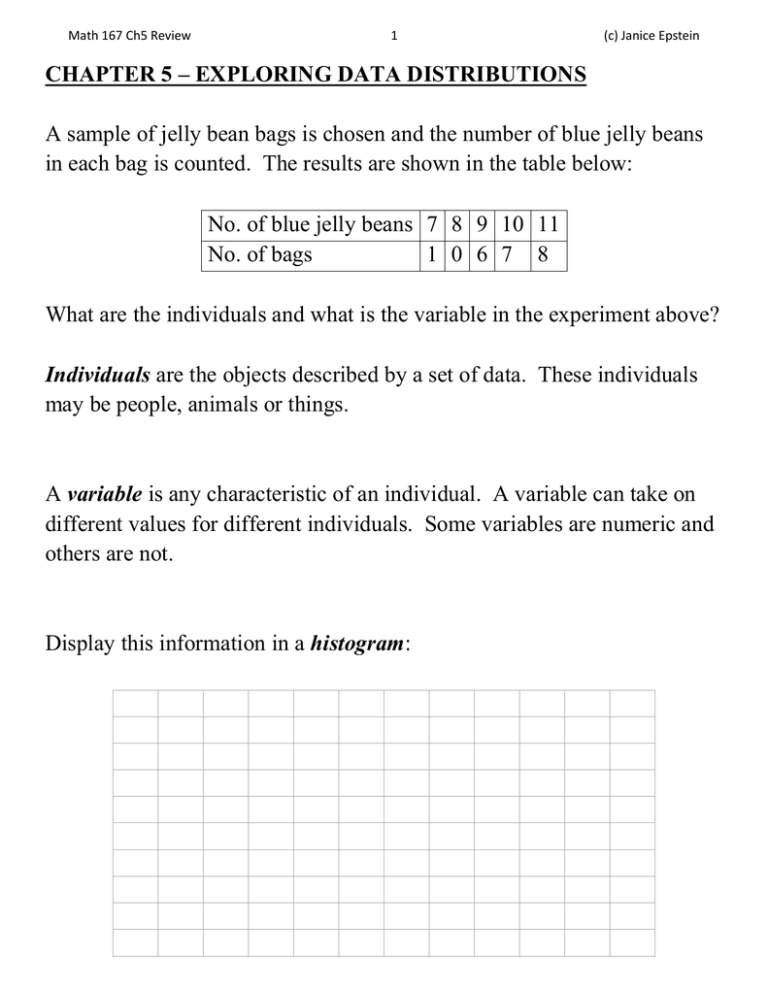
Math 167 Ch5 Review 1 (c) Janice Epstein CHAPTER 5 – EXPLORING DATA DISTRIBUTIONS A sample of jelly bean bags is chosen and the number of blue jelly beans in each bag is counted. The results are shown in the table below: No. of blue jelly beans 7 8 9 10 11 No. of bags 1 0 6 7 8 What are the individuals and what is the variable in the experiment above? Individuals are the objects described by a set of data. These individuals may be people, animals or things. A variable is any characteristic of an individual. A variable can take on different values for different individuals. Some variables are numeric and others are not. Display this information in a histogram: Math 167 Ch5 Review 2 (c) Janice Epstein Exploratory data analysis is the process of looking at data to describe the main features. Begin by looking at each variable and then the relationships between the variables. Graphs and numerical summaries are useful. The distribution of a variable tells us what values the variable takes and how often it takes these values. A histogram is a graph of the distribution of outcomes for a single numerical variable. The height of each bar is the number of observations in the class of outcomes covered by the base of the bar. All classes should have the same width and each observation must fall into exactly one class. Steps to creating a histogram 1. Choose the classes: Divide the range of the data into a reasonable number of classes of equal width. 2. Count the number of individuals in each class (frequency) 3. Draw the histogram. The vertical axis is the count in each class. The horizontal axis represents the classes. If you have data that ranges from a low value of 12 to a high value of 40, what will the classes be if the class size is 4? What if the class size is 5? Math 167 Ch5 Review 3 (c) Janice Epstein A graph is symmetric if the right and left sides of the histogram are approximately mirror images of each other. A graph is skewed to the right if the longer tail is on the right side. This is also called positively skewed A graph is skewed to the left if the longer tail is on the left side. This is also called negatively skewed. An outlier is an individual data value that falls outside the overall pattern. The histogram shows the lengths of words used in Shakespeare’s plays as a percent of all the words in his plays. What is the overall shape of this distribution? Comment on the shape of the histogram on the left Math 167 Ch5 Review 4 (c) Janice Epstein A stemplot is a display of the distribution of a variable that attaches the final digits of the observations as leaves on stems made up of all but the final digit. To Make A Stemplot 1. Separate each observation into a stem (consisting of all but the rightmost digit) and a leaf (the rightmost digit). 2. Write the stems in a vertical column with the smallest at the top. Include all the stem values from largest to smallest, even if some are not used. Draw a vertical line at the right of this column. 3. Write each leaf in the row to the right of its stem in increasing order Arrange the data into a stemplot 2, 3, 8, 10, 11, 11, 12, 16, 16, 22, 23, 57 Math 167 Ch5 Review 5 (c) Janice Epstein x1 + x2 + L + xn n This is also the “balance” point for our dot plots and histograms. The mean of the n numbers x1, x2, …, xn is x = The median of the n numbers x1, x2, …, xn is the number in the middle when the n number are arranged in order of size and there are an odd number of values. When there are an even number of values, the median is the mean of the two middle numbers. Half of our data is above the median and half is below. The mode of the n numbers x1, x2, …, xn is the number that occurs the most often. If no number occurs more often than any other number, there is no mode. If two numbers both occur the most often, then there are two modes. For the previous data (2, 3, 8, 10, 11, 11, 12, 16, 16, 22, 23, 57), where would the data “balance”? Where is the data cut in half? Which value occurred the most often? Math 167 Ch5 Review 6 (c) Janice Epstein What is the mean, median and mode for the number of blue jelly beans that we graphed earlier? Note these points on the histogram. No. of blue jelly beans 7 8 9 10 11 No. of bags 1 0 6 7 8 The range is a measure of spread of a set of observations. It is obtained by subtracting the smallest observation from the largest. To calculate the quartiles Q1 and Q3, 1. Use the median to split the data set into two halves – an upper half and a lower half. 2. The first quartile Q1 is the median of the lower half. 3. The third quartile Q3 is the median of the upper half. The interquartile range (or IQR) is Q3 Q1 Math 167 Ch5 Review 7 (c) Janice Epstein The five-number summary of a distribution consists of the following: Minimum Q1 M Q3 Maximum A boxplot is a graph of the five-number summary, An outlier is a data value that is less than Q1 – 1.5(IQR) or is greater than Q3 + 1.5(IQR). Find the range, the quartiles, the IQR and outliers (if any) for the data below. Display the data in a boxplot. 2, 3, 8, 10, 11, 11, 12, 16, 16, 22, 23, 57 Math 167 Ch5 Review 8 (c) Janice Epstein There are 4 different cases when finding the quartiles: 7 (or 11 or 15 or …) data points: 1 2 3 4 5 6 7 8 (or 12 or 16 or …) data points: 1 2 3 4 5 6 7 8 9 (or 13 or 17 or …) data points: 1 2 3 4 5 6 7 8 9 8 9 10 (or 14 or 18 or …) data points: 1 2 3 4 5 6 7 10 The boxplot below is for the number of grams of whole grain in a serving of 9 different cereals. If there are two modes, 6 and 18, what is a possible data set? Math 167 Ch5 Review 9 (c) Janice Epstein Another way to measure spread is the standard deviation, S. This will determine, on “average”, how far away are the measurements from the mean. To find the standard deviation in a set of n numbers, Find the mean of the numbers, 𝑥̅ . Subtract the mean from each of the values, 𝑥 − 𝑥̅ . Note that the sum of these values must be zero. Square the result of the subtractions, (𝑥 − 𝑥̅ )2 Add up the squares, ∑(𝑥 − 𝑥̅ )2 Divide by n 1 and then take the square root, 𝑆 = √ ∑(𝑥−𝑥̅ )2 𝑛−1 Find the standard deviation in the golf scores for Amy, Bart, and Caleb. Whose scores vary the least? Amy 67 Bart 70 Caleb 79 71 72 78 66 80 80 66 82 81 Math 167 Ch5 Review 10 (c) Janice Epstein Many natural and social phenomena produce a continuous distribution with a bell-shaped curve. Every bell-shaped (NORMAL) curve has the following properties: Its peak occurs directly above the mean The curve is symmetric about a vertical line through the mean. The curve never touches the x-axis. It extends indefinitely in both directions. The area between the curve and the x-axis is always 100% as that is the total probability that something is observed. The shape of the curve is completely determined by the mean and the standard deviation. The place where the curve changes from concave down [ ]to concave up [ ] is one standard deviation away from the mean. The first and third quartiles are located 0.67 standard deviations away from the mean. The probability that a data value will fall between two values a and b is given by the area under the curve between a and b. The standard normal curve has a mean of 0, standard deviation of 1 and uses the letter Z for the variable. To find the z-score (how many standard deviations from the mean) for a value X, use the formula Math 167 Ch5 Review 11 Z (c) Janice Epstein X If you are given the z-score, the X value is X Z The weight of an egg is normally distributed with a mean weight of 65 grams with a standard deviation of 5 grams. (a) Sketch the normal curve for this distribution: ___________________ (b) Determine the z-score for the following weights: 70 grams 79 grams 63 grams (c) Where are the first and third quartiles located? Math 167 Ch5 Review 12 (c) Janice Epstein In any normal distribution, About 68% of the data is within 1 standard deviation of the mean About 95% of the data is within 2 standard deviations of the mean About 99.7% of the data is within 3 standard deviations of the mean. The time to run a long race is 45 minutes with a standard deviation of 3 minutes. (a) What is the probability that a racer takes longer than 48 minutes? (b) What is the probability that a racer takes less than 51 minutes? (c) What is the probability that a racer takes between 42 and 45 minutes? (d) If there are 1000 runners, how many will finish between 36 and 54 minutes? Math 167 Ch5 Review 13 (c) Janice Epstein SAMPLE EXAM QUESTIONS FROM CHAPTER 5 A bag of chocolate chip cookies is opened and the number of chocolate chips in each cookie is counted. The results are 17 18 19 19 20 20 21 22 22 23 25 25 29 30 30 30 31 31 31 32 33 36 37 38 39 (a) Find the following quantities: Mean = ________________ Mode = ________________ Median = ______________ Range = ________________ Q1 = ________________ Q3 = ________________ (b) Display the information in a histogram with class size of 3 Math 167 Ch5 Review 14 (c) Janice Epstein y z x The distribution above is (A) skewed right (B) symmetric (C) skewed left If y is the median of this distribution, which value is the mean? (A) x (B) z (C) more information is needed Match the distributions to the survey questions (i) Are you male (0) or female (1)? (ii) Are you right (0) or left (1) handed? (iii) What is your height to the nearest inch? (iv) How many minutes do you study on Friday evening? Math 167 Ch5 Review 15 (c) Janice Epstein The data below is the number of cases of xyz disease reported in a county each month recently. Arrange this in a stemplot. 91 115 115 125 127 129 130 131 140 Display the data below in a dot plot and indicate where the balance point is located. 6 12 11 7 5 5 5 10 12 10 The number of parking tickets issued each hour in a parking garage is given below. What is the standard deviation in the number of parking tickets issued? 5 4 7 10 4 Math 167 Ch5 Review 16 (c) Janice Epstein Which histogram has the larger standard deviation? (A) Histogram I (B) Histogram II (C) They are nearly the same (D) There is not enough information to decide A data distribution has a minimum value of 7, Q1 = 33, M = 42, Q3 = 49, and the maximum value is 66. Which statements below (if any) are true about this distribution? (A) There are no outliers (B) There is at least one low outlier (C) There is at least one high outlier (D) There is not enough information to determine if there are outliers. (E) None of these Math 167 Ch5 Review 17 (c) Janice Epstein The length of crayons in a box of used crayons is normally distributed with a mean of 3 inches and a standard deviation of 0.5 inches. (a) Sketch the distribution (b) What is the probability that a crayon is shorter than 3.5 inches. (c) If the box has 200 crayons in it, how many are between 2 and 3 inches long? A normal curve has a mean of 80 and a standard deviation of 10. Where is the 1st quartile located? (A) need more information to determine. (B) none of these (C) 77.5 (D) 73.3 (E) 70.0
![Area (Section 6.2) [ ]](http://s2.studylib.net/store/data/010413671_1-efe902d3637e0ae3939f101c43978461-300x300.png)