The 2005 HST Calibration Workshop
Space Telescope Science Institute, 2005
A. M. Koekemoer, P. Goudfrooij, and L. L. Dressel, eds.
A Recalibration of Optical Photometry Based on STIS
Spectrophotometry
J. Maı́z Apellániz1
Space Telescope Science Institute, 3700 San Martin Drive, Baltimore, MD 21210,
U.S.A.
Abstract. I use STIS spectrophotometry to test the published sensitivity curves
P (λ) and calculate the zero points ZPP for three optical photometry systems: Tycho2 BT VT , Strömgren uvby, and Johnson U BV . The analysis includes the new recalibration of grating/aperture corrections, vignetting, and charge transfer inefficiency
effects produced by the STIS group and considers the consequences of both random
and systematic uncertainties. For Tycho-2 BT and VT , Strömgren v, b, and y, and
Johnson B and V , I find that the published sensitivity curves are consistent with
the available photometry and spectrophotometry and I provide new values for the
associated zero points. The situation is different for the Strömgren u and the Johnson U filters. There I find that the published sensitivity curves yield results that are
inconsistent with the available photometry and spectrophotometry, likely caused by
an incorrect treatment of atmospheric effects in the short-wavelength end. I reanalyze the data to produce new average sensitivity curves for those two filters and new
values for ZPc1 and ZPU −B . The new computation of synthetic U − B and B − V
colors uses a single B sensitivity curve, which eliminates the previous unphysical
existence of different definitions for each color.
1.
Description
• I use STIS spectrophotometry to test the published sensitivity curves P (λ) and calculate the zero points ZPP for three optical photometry systems.
mP = −2.5 log10
R
P (λ)fλ (λ)λ dλ
R
P (λ)fλ,ref (λ)λ dλ
!
+ ZPP
• The spectrophotometry was obtained from (a) the Next Generation Spectral Library
(NGSL, Gregg et al. 2004 and this meeting) which includes 255 non-variable goodquality stars and from (b) the Bohlin sample (Bohlin et al. 2001, Bohlin & Gilliland
2004a) which includes another 19 stars. The two samples span a wide range of temperatures, gravities and metallicities. For each of the 274 stars a high S/N spectrum that
includes the 3 000-7 000 Å wavelength range was built by combining data obtained
with the STIS G430L and G750L gratings. The data were processed using the latest
calibration files and algorithms from the STIS pipeline.
• The Tycho-2 photometry for the NGSL and Bohlin samples was collected directly
from Høg et al. (2000) while the equivalent Strömgren and Johnson photometry had
1
Affiliated wuth the Space Telescope Division of the European Space Agency, ESTEC, Noordwijk, Netherlands.
228
c Copyright 2005 Space Telescope Science Institute. All rights reserved.
A Recalibration of Optical Photometry
229
0.20
(BT,phot−VT,phot)−(BT,spec−VT,spec)
0.15
0.10
0.05
0.00
−0.05
NGSL sample
−0.10
−0.5
Bohlin sample
0.0
0.5
1.0
1.5
2.0
BT,phot−VT,phot
Figure 1: Comparison between photometric and spectrophotometric BT − VT colors as a
function of photometric BT − VT for the NGSL + Bohlin samples using the Bessell (2000)
sensitivity curves. The error bars represent the photometric uncertainties and the horizontal
blue line marks the proposed ZPBT −VT . The green line shows the result of a weighted linear
fit to the data.
to be compiled from the General Catalogue of Photometric Data (GCPD, Mermilliod
et al. 1997). A careful procedure to eliminate incorrect photometric values and to
assign more significance to the data with better quality was followed in the latter case.
• The full results of this work are presented in Maı́z Apellániz (2006). The ZPs and the
new sensitivity curves (see below) will be implemented in the version 2.0 of CHORIZOS (Maı́z Apellániz 2004)
2.
Tycho-2 BT VT
• I have reanalyzed the previous results of Maı́z Apellániz (2005), which were obtained
using a previous STIS calibration.
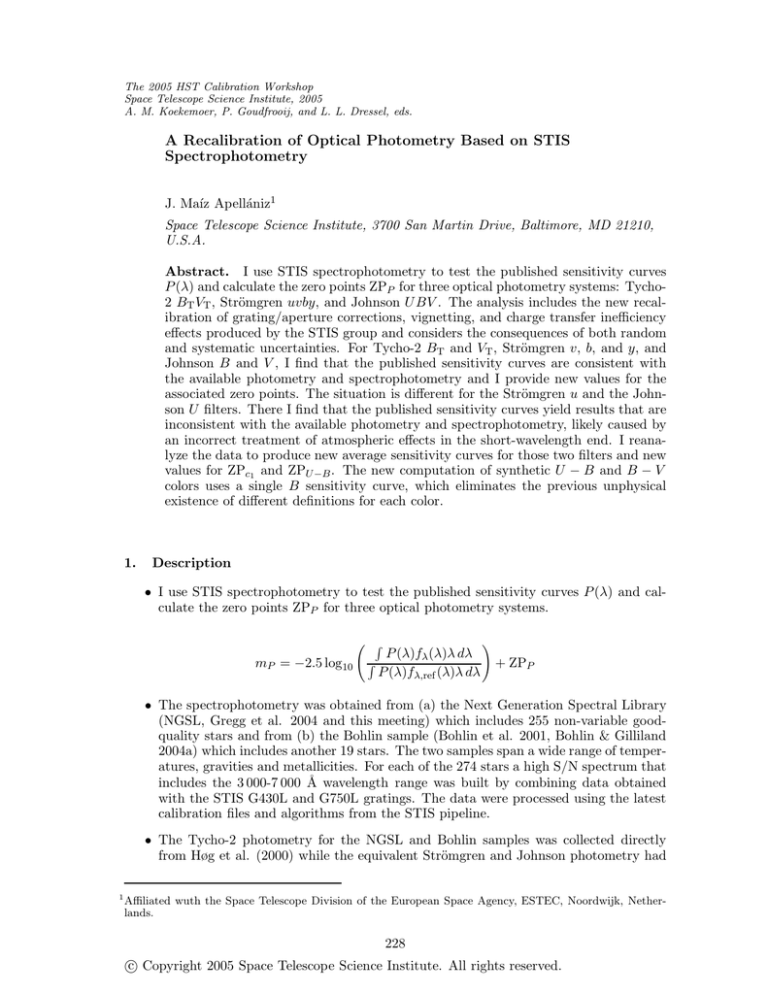
• The BT and VT sensitivity curves of Bessell (1990) are accurate, as evidenced by
the small slope present in the fit in Figure 1. This confirms the previous results on
the stability for the Tycho-2 photometry and the adequacy of the NGSL and Bohlin
datasets for the testing of UV-optical sensitivity curves and the calculation of ZPs.
• New ZPs are presented in Tables 1 and 2 which are only slightly different from those
given by Maı́z Apellániz (2005).
• The consistency of the VT calibration was checked by computing ZPVT using two
different datasets and methods.
230
Maı́z Apellániz
Figure 2: Matsushima (1969) photon-counting normalized sensitivity curves for the the
three Strömgren filters u, v, and b filters and the new Maı́z Apellániz (2006) curve for u.
Three normalized SEDs from the two samples used to calibrate the Strömgren photometry
are also shown as fλ .
Figure 3: Bessell (1990) U (UX) and B (B) and Buser & Kurucz (1978) U (U3 ) photoncounting normalized sensitivity curves and the new Maı́z Apellániz (2006) curve for U .
Three normalized SEDs from the two samples used to calibrate the Johnson photometry
are also shown as fλ .
A Recalibration of Optical Photometry
231
• The Tycho-2 ZPs have precisions better than one hundredth of a magnitude, implying
that the published uncertainties (which are typically several times larger) can be in
most cases directly compared with synthetic photometry results without having to
invoke additional sources of systematic errors.
3.
Strömgren uvby
• I have collected b − y, m1 (v − 2b + y), and c1 (u − 2v + b) data from the GCPD. After
the selection and filtering process, I ended up with a total of 104 stars, 100 from the
NGSL sample and 4 from the Bohlin sample.
• The v, b, and y sensitivity curves of Matsushima (1969) are accurate.
• The u sensitivity curve of Matsushima (1969) yields a significant slope in a (b − y)phot
vs. c1,phot -c1,spec plot, indicating that it is not an accurate representation of the
published photometry.
• I have used a χ2 minimization algorithm to calculate a new Strömgren u sensitivity
curve (Figure 2). The new curve is quite similar to the Matsushima (1969) one but has
a short-wavelength edge which is redder by ≈ 35 Å. The likely culprit for the difference
between the two is a difference in atmospheric transmission or in the reduction process
to extrapolate to zero air mass. The new sensitivity curve yields a much better fit to
the data.
• The new ZPs are given in Table 1. Their precisions are similar to those for Tycho-2.
• I show in Table 3 the typical uncertainties for individual Strömgren photometric entries in the GCPD, as measured by comparing them with the corresponding spectrophotometric values. Little variation is observed as a function of magnitude or the
number of measurements per entry, so those values can be applied to the full GCPD
once the outliers (which comprise 2-6% of the entries) are eliminated. In all three cases
(b − y, m1 , and c1 ) the uncertainties are several times larger than the ZP precisions,
so the data can be directly compared with synthetic photometry results.
4.
Johnson U BV
• I have collected V , B − V , and U − B data from the GCPD. After the selection and
filtering process, I ended up with a total of 108, 111, and 101 stars, respectively.
• The data are consistent with the Vega V magnitude of 0.026±0.008 derived by Bohlin
& Gilliland (2004b), which can be used as ZPV .
• The B and V sensitivity curves of Bessell (1990) are accurate.
• Both of the U sensitivity curves of Buser & Kurucz (1978) and Bessell (1990) are
inconsistent with the observed U − B photometry.
• I have derived a new Johnson U sensitivity curve (Figure 3). The new curve has a
plateau in the 3200-3500 Å region that is likely caused by an averaging over different
effective sensitivities used under different conditions. The fit to the U − B data using
the new U sensitivity curve is better than using the previous two, but the residuals
are larger than for other colors and indices.
232
Maı́z Apellániz
• The new ZPs are given in Table 1. The precision for ZPB−V is similar to the previous
ones but the one for ZPU −B is considerably worse. Therefore, it is not possible to
eliminate systematic errors beyond 0.01 magnitudes for archival U − B photometry.
• I show in Table 3 the typical uncertainties for individual Johnson photometric entries
in the GCPD. As in the Strömgren case, little variation is observed as a function of
magnitude and the outliers comprise 2-6% of the entries. The random uncertainties
for Johnson photometry are found to be larger than for the Strömgren case.
Table 1: Color/index zero points and associated uncertainties/errors.
zero point
random
systematic
Tycho-2
BT − VT
0.033
0.001
0.005
Strömgren
b−y
m1
c1
0.007 0.154 1.092
0.001 0.001 0.002
0.003 0.003 0.004
Johnson
B−V U −B
0.010
0.020
0.001
0.006
0.004
0.014
Table 2: Magnitude zero points and associated uncertainties.
zero point
uncertainty
Tycho-2
VT
0.034
0.006
Johnson
V
0.026
0.008
Table 3: Random uncertainties for individual entries in the GCPD.
Strömgren
b−y
m1
c1
0.013 0.014 0.018
Johnson
B−V U −B
0.020
0.028
A Recalibration of Optical Photometry
Acknowledgments.
suggestions.
233
I would like to thank Ralph Bohlin and Jay Holberg for useful
References
Bessell, M. S. 1990, PASP 102, 1181
Bessell, M. S. 2000, PASP 112, 961
Bohlin, R. C., Dickinson, M. E., and Calzetti, D. 2001, AJ 122, 2118
Bohlin, R. C. and Gilliland, R. L. 2004a, AJ 128, 3053
Bohlin, R. C. and Gilliland, R. L. 2004b, AJ 127, 3508
Buser, R. and Kurucz, R. L. 1978, A&A 70, 555
Gregg, M. D., et al. 2004, American Astronomical Society Meeting Abstracts 205
Høg, E., et al. 2000, A&A 355, L27
Maı́z Apellániz, J. 2004, PASP 116, 859
Maı́z Apellániz, J. 2005, PASP 117, 615
Maı́z Apellániz, J. 2006, AJ 131, 1184
Matsushima, S. 1969, ApJ 158, 1137
Mermilliod, J.-C., Mermilliod, M., and Hauck, B. 1997, A&AS 124, 349


