Page 1 Section 3.2: Measures of Central Tendency
advertisement
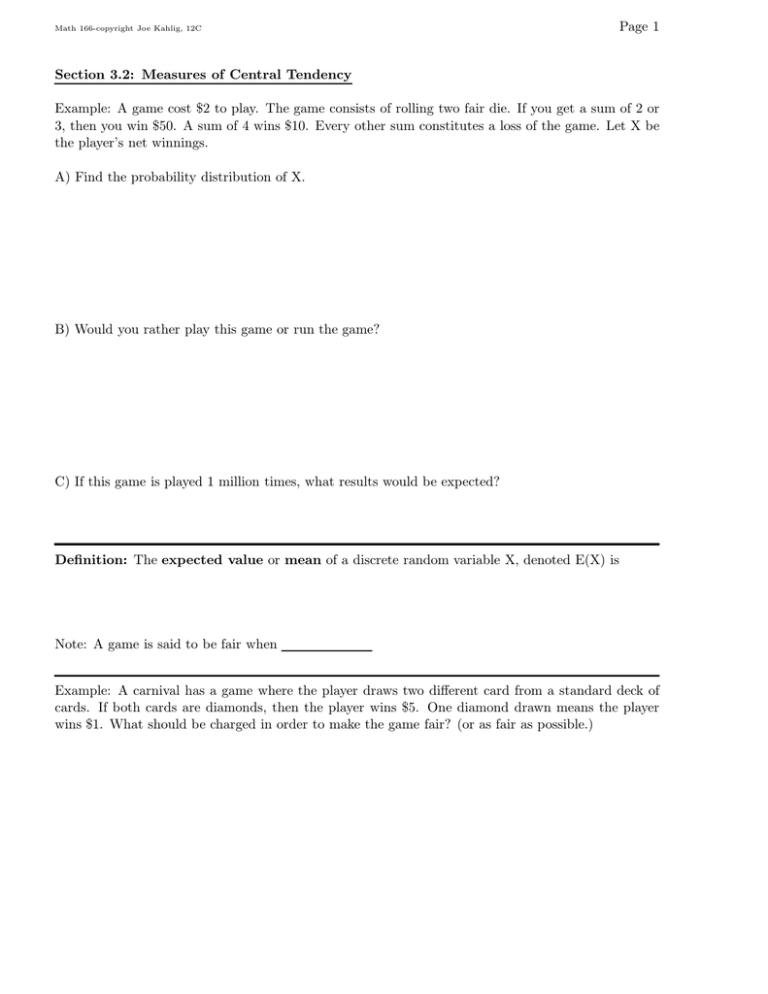
Math 166-copyright Joe Kahlig, 12C Page 1 Section 3.2: Measures of Central Tendency Example: A game cost $2 to play. The game consists of rolling two fair die. If you get a sum of 2 or 3, then you win $50. A sum of 4 wins $10. Every other sum constitutes a loss of the game. Let X be the player’s net winnings. A) Find the probability distribution of X. B) Would you rather play this game or run the game? C) If this game is played 1 million times, what results would be expected? Definition: The expected value or mean of a discrete random variable X, denoted E(X) is Note: A game is said to be fair when Example: A carnival has a game where the player draws two different card from a standard deck of cards. If both cards are diamonds, then the player wins $5. One diamond drawn means the player wins $1. What should be charged in order to make the game fair? (or as fair as possible.) Math 166-copyright Joe Kahlig, 12C Page 2 Example: A company sell one year term life insurance policies for $800. The face value of the policy is $25,000. Life insurance tables have determined that the probability that a person interested in this pollicy will survive the year is 0.97. What is the companies expected profit on this product? Example: A multiple choice exam has 10 questions where each question has 5 answers. If a student guesses at all of the questions, what is the expected number of questions that the student will get correct? What is the student’s expected grade on the exam? Note: The expected value of a binomial distribution with n trials and probability of success, p, is Example: A company has a production line that has a historic defect rate of 4.5%. If a random sample of 450 items are collected, how many of the items would we expect to be good? Definition: The mean of a data set is the traditional average. The median of a data set is the middle of the data when the data is ordered. The mode of a data set are the values that have the largest frequencies. Example: Compute the mean, median, and mode of these data values. 90, 75, 50, 85, 85, 50, 60, 65, 95 Page 3 Math 166-copyright Joe Kahlig, 12C Example: Compute the mean, median, and mode of these data values. 40, 50, 65, 70, 75, 90, 95, 100 Example: Compute the mean and mode of these data values. X freq. 7 9 9 9 12 7 15 10 Example: Compute the mean and mode of this probability distribution. X prob. 1 0.2 3 0.15 4 0.1 6 0.3 7 0.25 Example: The distribution of grades on an exam are given in the table. Discuss the values for the mean and mode. grades 90 ≤ x ≤ 99 80 ≤ x ≤ 89 70 ≤ x ≤ 79 60 ≤ x ≤ 69 50 ≤ x ≤ 59 40 ≤ x ≤ 49 Freq. 8 15 18 11 5 2 Math 166-copyright Joe Kahlig, 12C Page 4 Example: Five people take an exam. The grades are 70, 73, 81, and 92 A) If the median is 81, what is the missing grade? B) If the median is 78, what is the missing grade? Example: Explain the difference between a population and a sample. Example: A class of 100 students is divided into 4 lab sections: A, B, C, and D . After the first exam, the averages for the first three sections were 75.5, 64.2 and 68 respectively and the average for the entire class was 73.8. Do these numbers represent a sample or a population?
