Group velocity dependence of propagation losses in single-line-defect photonic crystal
advertisement
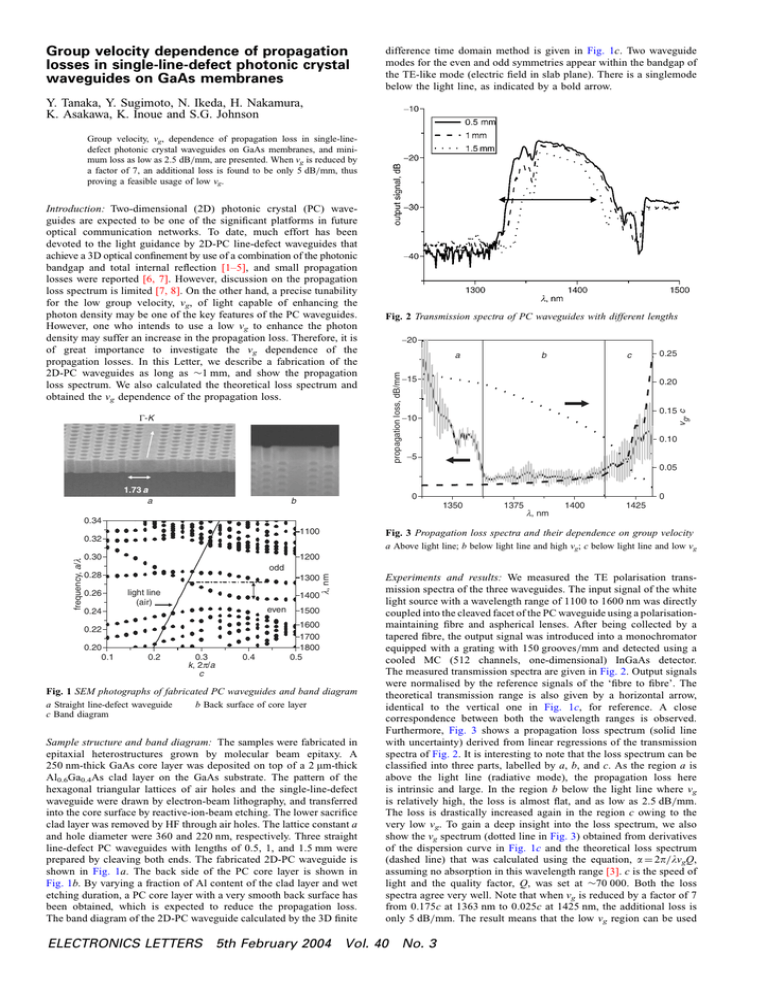
Group velocity dependence of propagation losses in single-line-defect photonic crystal waveguides on GaAs membranes difference time domain method is given in Fig. 1c. Two waveguide modes for the even and odd symmetries appear within the bandgap of the TE-like mode (electric field in slab plane). There is a singlemode below the light line, as indicated by a bold arrow. Y. Tanaka, Y. Sugimoto, N. Ikeda, H. Nakamura, K. Asakawa, K. Inoue and S.G. Johnson Group velocity, vg, dependence of propagation loss in single-linedefect photonic crystal waveguides on GaAs membranes, and minimum loss as low as 2.5 dB=mm, are presented. When vg is reduced by a factor of 7, an additional loss is found to be only 5 dB=mm, thus proving a feasible usage of low vg. -20 a b c -15 0.25 0.20 0.15 -10 vg, c G-K Fig. 2 Transmission spectra of PC waveguides with different lengths propagation loss, dB/mm Introduction: Two-dimensional (2D) photonic crystal (PC) waveguides are expected to be one of the significant platforms in future optical communication networks. To date, much effort has been devoted to the light guidance by 2D-PC line-defect waveguides that achieve a 3D optical confinement by use of a combination of the photonic bandgap and total internal reflection [1–5], and small propagation losses were reported [6, 7]. However, discussion on the propagation loss spectrum is limited [7, 8]. On the other hand, a precise tunability for the low group velocity, vg, of light capable of enhancing the photon density may be one of the key features of the PC waveguides. However, one who intends to use a low vg to enhance the photon density may suffer an increase in the propagation loss. Therefore, it is of great importance to investigate the vg dependence of the propagation losses. In this Letter, we describe a fabrication of the 2D-PC waveguides as long as 1 mm, and show the propagation loss spectrum. We also calculated the theoretical loss spectrum and obtained the vg dependence of the propagation loss. 0.10 -5 0.05 1.73 a a 0 b 1100 1400 1425 Fig. 3 Propagation loss spectra and their dependence on group velocity a Above light line; b below light line and high vg; c below light line and low vg 1200 0.30 odd 0.28 1300 light line (air) 1400 even 0.24 0.22 0.2 0.3 k, 2p/a c 0.4 l, nm frequency, a/l 0.32 0.20 0.1 1375 l, nm 0.34 0.26 0 1350 1500 1600 1700 1800 0.5 Fig. 1 SEM photographs of fabricated PC waveguides and band diagram a Straight line-defect waveguide c Band diagram b Back surface of core layer Sample structure and band diagram: The samples were fabricated in epitaxial heterostructures grown by molecular beam epitaxy. A 250 nm-thick GaAs core layer was deposited on top of a 2 mm-thick Al0.6Ga0.4As clad layer on the GaAs substrate. The pattern of the hexagonal triangular lattices of air holes and the single-line-defect waveguide were drawn by electron-beam lithography, and transferred into the core surface by reactive-ion-beam etching. The lower sacrifice clad layer was removed by HF through air holes. The lattice constant a and hole diameter were 360 and 220 nm, respectively. Three straight line-defect PC waveguides with lengths of 0.5, 1, and 1.5 mm were prepared by cleaving both ends. The fabricated 2D-PC waveguide is shown in Fig. 1a. The back side of the PC core layer is shown in Fig. 1b. By varying a fraction of Al content of the clad layer and wet etching duration, a PC core layer with a very smooth back surface has been obtained, which is expected to reduce the propagation loss. The band diagram of the 2D-PC waveguide calculated by the 3D finite Experiments and results: We measured the TE polarisation transmission spectra of the three waveguides. The input signal of the white light source with a wavelength range of 1100 to 1600 nm was directly coupled into the cleaved facet of the PC waveguide using a polarisationmaintaining fibre and aspherical lenses. After being collected by a tapered fibre, the output signal was introduced into a monochromator equipped with a grating with 150 grooves=mm and detected using a cooled MC (512 channels, one-dimensional) InGaAs detector. The measured transmission spectra are given in Fig. 2. Output signals were normalised by the reference signals of the ‘fibre to fibre’. The theoretical transmission range is also given by a horizontal arrow, identical to the vertical one in Fig. 1c, for reference. A close correspondence between both the wavelength ranges is observed. Furthermore, Fig. 3 shows a propagation loss spectrum (solid line with uncertainty) derived from linear regressions of the transmission spectra of Fig. 2. It is interesting to note that the loss spectrum can be classified into three parts, labelled by a, b, and c. As the region a is above the light line (radiative mode), the propagation loss here is intrinsic and large. In the region b below the light line where vg is relatively high, the loss is almost flat, and as low as 2.5 dB=mm. The loss is drastically increased again in the region c owing to the very low vg. To gain a deep insight into the loss spectrum, we also show the vg spectrum (dotted line in Fig. 3) obtained from derivatives of the dispersion curve in Fig. 1c and the theoretical loss spectrum (dashed line) that was calculated using the equation, a ¼ 2p=lvgQ, assuming no absorption in this wavelength range [3]. c is the speed of light and the quality factor, Q, was set at 70 000. Both the loss spectra agree very well. Note that when vg is reduced by a factor of 7 from 0.175c at 1363 nm to 0.025c at 1425 nm, the additional loss is only 5 dB=mm. The result means that the low vg region can be used ELECTRONICS LETTERS 5th February 2004 Vol. 40 No. 3 with low losses. 1 Conclusion: We fabricated long PC waveguides and obtained the propagation loss spectrum from their transmission spectra. From comparison with the theoretical one, the vg dependence of the propagation loss is experimentally obtained and the possible usage of the low vg is demonstrated. 2 3 Acknowledgment: This work was supported by the New Energy and Industrial Technology Development Organisation (NEDO) within the framework of the Femtosecond Technology Project. 4 # IEE 2004 Electronics Letters online no: 20040114 doi: 10.1049/el:20040114 21 November 2003 5 Y. Tanaka, Y. Sugimoto, N. Ikeda, H. Nakamura and K. Asakawa (Femtosecond Technology Research Association, 5-5 Tokodai, Tsukuba 300-2635, Japan) 6 E-mail: tanaka@festa.or.jp K. Inoue (Chitose Institute of Science and Technology, 758-65 Vivi, Chitose 066-8655, Japan) 7 S.G. Johnson (Department of Physics and Center for Materials Science and Engineering, Massachusetts Institute of Technology, Cambridge, MA 02139, USA) 8 Sugimoto, Y., Ikeda, N., Carlsson, N., Asakawa, K., Kawai, N., and Inoue, K.: ‘Theoretical and experimental investigation of straight defect waveguides in AlGaAs-based air-bridge-type two-dimensional photonic crystal slabs’, Appl. Phys. Lett., 2001, 79, pp. 4286–4288 Lončar, M., Nedeljković, D., Doll, T., Včkovič, J., Scherer, A., and Pearsall, T.P.: ‘Waveguiding in planar photonic crystals’, Appl. Phys. Lett., 2000, 77, pp. 1937–1939 Letartre, X., Seassal, C., Grillet, C., Rojo-Romeo, P., Viktorovitch, P., Vassor D’yerville, M. Le., Cassagne, D., and Jouanin, C.: ‘Group velocity and propagation losses measurement in a single-line photonic-crystal waveguide on InP membranes’, Appl. Phys. Lett., 2001, 79, pp. 2312–2314 Smith, C.J., Benisty, H., Olivier, S., Rattier, M., Weisbuch, C., Krauss, T.F., De la rue, R.M., Houdre, R., and Oesterle, U.: ‘Low-loss channel waveguides with two-dimensional photonic crystal boundaries’, Appl. Phys. Lett., 2000, 77, pp. 2813–2815 Johnson, S.G., Villeneuve, P.R., Fan, S., and Joannopoulos, J.D.: ‘Linear waveguides in photonic crystal slabs’, Phys. Rev. B, 2000, 62, pp. 8212–8222 Notomi, M., Shinya, A., Yamada, K., Takahashi, J., Takahashi, C., and Yokoyama, I.: ‘Singlemode transmission within photonic bandgap of width-varied single-line-defect photonic crystal waveguides on SOI substrates’, Electron. Lett., 2001, 37, pp. 293–295 Arentoft, J., Sondergaard, T., Kristensen, M., Boltasseva, A., Thorhauge, L., and Frandsen, L.: ‘Low-loss silicon-on-insulator photonic crystal waveguides’, Electron. Lett., 2002, 38, pp. 274–275 Baba, T., Fukaya, N., and Motegi, A.: ‘Clear correspondence between theoretical and experimental light propagation characteristics in photonic crystal waveguides’, Electron. Lett., 2001, 37, pp. 761–762 References ELECTRONICS LETTERS 5th February 2004 Vol. 40 No. 3

