Chemical composition of stream water in mixed alpine & subalpine watersheds
advertisement
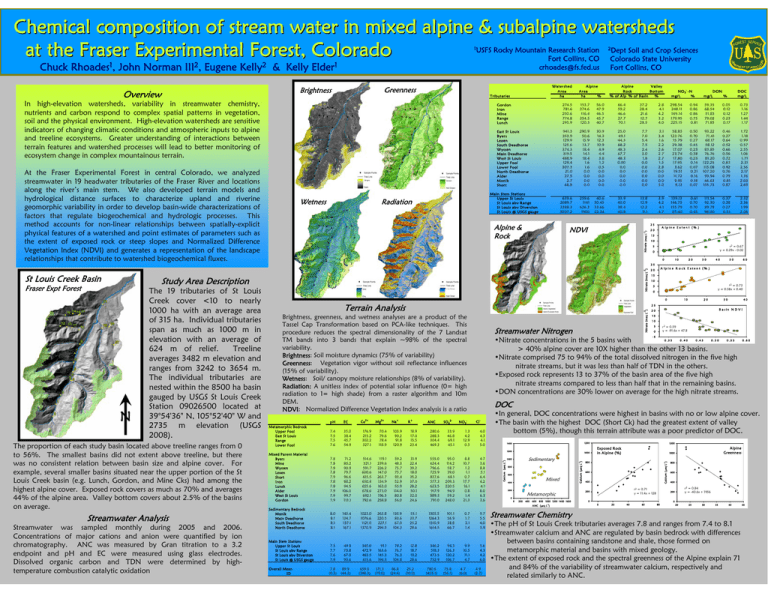
Chemical composition of stream water in mixed alpine & subalpine watersheds at the Fraser Experimental Forest, Colorado 1USFS Greenness Brightness Overview In high-elevation watersheds, variability in streamwater chemistry, nutrients and carbon respond to complex spatial patterns in vegetation, soil and the physical environment. High-elevation watersheds are sensitive indicators of changing climatic conditions and atmospheric inputs to alpine and treeline ecosystems. Greater understanding of interactions between terrain features and watershed processes will lead to better monitoring of ecosystem change in complex mountainous terrain. At the Fraser Experimental Forest in central Colorado, we analyzed streamwater in 19 headwater tributaries of the Fraser River and locations along the river’s main stem. We also developed terrain models and hydrological distance surfaces to characterize upland and riverine geomorphic variability in order to develop basin-wide characterizations of factors that regulate biogeochemical and hydrologic processes. This method accounts for non-linear relationships between spatially-explicit physical features of a watershed and point estimates of parameters such as the extent of exposed rock or steep slopes and Normalized Difference Vegetation Index (NDVI) and generates a representation of the landscape relationships that contribute to watershed biogeochemical fluxes. Wetness Soil and Crop Sciences Colorado State University Fort Collins, CO Tributaries Watershed Area ha Gordon Iron Mine Range Lunch 274.5 781.6 250.6 774.8 295.9 153.7 374.6 116.4 354.5 120.3 56.0 47.9 46.5 45.7 40.7 66.4 59.2 46.6 27.7 70.1 37.2 28.4 21.6 12.7 28.5 2.8 4.1 4.2 3.2 4.0 298.54 248.11 149.14 179.95 225.15 0.94 0.86 0.86 0.75 0.81 59.35 68.54 51.83 79.02 71.85 0.05 0.12 0.12 0.23 0.17 0.73 1.16 1.27 1.44 1.17 East St Louis Byers Lexen South Deadhorse Wyssen Main Deadhorse West St Louis Upper Fool Lower Fool North Deadhorse Alder Monik Short 941.3 353.9 129.9 125.6 374.3 319.5 488.9 129.4 307.3 21.0 27.5 2.7 68.8 290.9 50.6 15.9 13.7 18.4 14.1 18.4 1.6 1.6 0.0 0.0 0.0 0.0 30.9 14.3 12.3 10.9 4.9 4.4 3.8 1.2 0.5 0.0 0.0 0.0 0.0 25.0 49.1 44.3 68.2 48.3 67.7 48.3 0.00 0.0 0.0 0.0 0.0 0.0 7.7 7.0 5.4 7.5 2.4 3.0 1.8 0.0 0.0 0.0 0.0 0.0 0.0 3.1 3.4 1.6 2.2 2.6 2.7 2.7 1.5 2.8 0.0 0.0 0.0 5.0 58.83 123.76 15.79 29.38 17.07 23.74 17.80 17.95 3.62 19.51 11.72 9.95 9.13 0.50 0.70 0.27 0.45 0.23 0.38 0.23 0.14 0.07 0.21 0.16 0.18 0.07 93.22 71.41 68.17 58.12 83.85 76.76 81.20 122.25 115.08 107.20 93.94 66.63 155.73 0.46 0.27 0.64 0.52 0.66 0.56 0.72 0.83 0.92 0.76 0.79 0.81 0.87 1.72 1.18 0.99 0.57 2.55 1.06 1.71 2.31 2.56 2.17 1.76 2.03 2.69 639.6 2089.7 3388.3 8507.2 259.6 1141 636.3 1900 40.6 30.45 33.66 22.34 33.9 40.0 38.4 40.8 13.8 12.9 12.2 9.1 3.9 4.2 4.1 4.7 139.13 146.75 155.79 65.40 0.61 0.70 0.70 0.45 111.54 92.30 89.78 98.00 0.37 0.28 0.27 0.51 2.32 2.36 1.99 2.06 Main Stem Stations Upper St Louis St Louis abv Range St Louis abv Diversion St Louis @ USGS gauge Radiation Alpine & Rock Alpine Area ha % 2Dept Alpine Valley Rock Bottom % of Alp % of Basin % 25 NDVI Nitrate (meq L -1 ) Chuck Rhoades1, John Norman III2, Eugene Kelly2 & Kelly Elder1 Rocky Mountain Research Station Fort Collins, CO crhoades@fs.fed.us - NO3 -N mg/L % DON mg/L % DOC mg/L A lp in e E x t e n t ( % ) 20 15 10 r2 = 0.67 y = 0.29x - 0.02 5 0 0 10 20 30 40 50 60 Study Area Description Streamwater Analysis Streamwater was sampled monthly during 2005 and 2006. Concentrations of major cations and anion were quantified by ion chromatography. ANC was measured by Gran titration to a 3.2 endpoint and pH and EC were measured using glass electrodes. Dissolved organic carbon and TDN were determined by hightemperature combustion catalytic oxidation 15 10 r2 = 0.73 y = 0.58x + 0.40 5 0 Upper Fool East St Louis Range Lower Fool 7.4 7.5 7.5 7.6 35.0 38.4 45.7 54.9 2+ + 176.9 215.2 302.2 327.1 70.4 79.6 78.4 118.9 103.9 90.2 91.8 120.9 + 18.9 17.0 15.5 23.4 4 280.6 288.3 304.4 469.3 2- 33.9 46.8 69.1 45.1 3 - 1.3 4.2 12.9 0.3 Streamwater Nitrogen Cl 4.0 4.3 4.1 5.0 514.6 521.1 591.7 600.6 615.5 650.4 655.6 678.6 692.1 792.6 119.1 239.6 226.2 147.0 263.7 134.9 163.0 273.0 196.3 258.8 59.2 48.3 75.7 75.7 93.4 52.9 55.9 114.0 80.8 56.0 31.9 22.4 39.2 18.0 35.2 37.0 28.2 50.1 32.0 24.6 555.0 624.4 796.6 725.9 837.6 577.3 623.5 917.9 889.3 791.0 95.0 114.2 58.7 39.0 68.1 209.3 220.5 94.9 59.2 248.0 8.8 10.7 1.2 1.1 0.7 17.7 16.1 0.8 1.4 21.3 4.7 3.6 8.8 5.1 6.4 4.2 4.1 8.0 6.3 3.6 Sedimentary Bedrock Monik Main Deadhorse South Deadhorse North Deadhorse 8.0 8.1 8.1 8.1 145.4 134.7 137.1 167.1 1023.0 1076.6 1121.0 1370.9 263.8 220.5 227.1 294.5 135.9 83.6 67.0 104.3 53.1 33.7 25.2 28.6 1305.5 1264.3 1310.9 1614.5 101.1 56.9 38.8 66.7 0.7 1.7 2.1 1.4 9.7 5.5 4.0 5.9 Main Stem Stations Upper St Louis St Louis abv Range St Louis abv Diversion St Louis @ USGS gauge 7.5 7.7 7.6 7.9 49.8 70.8 67.0 90.6 340.0 472.9 463.5 615.6 91.1 163.6 145.3 194.3 78.2 76.7 76.3 104.8 12.8 18.7 19.2 28.6 346.2 518.3 473.5 732.9 94.3 126.3 120.2 106.7 9.9 10.5 11.1 4.7 5.6 4.3 4.2 6.0 89.9 (44.2) 659.0 (398.3) 780.6 (455.1) 75.8 (56.1) 4.7 (6.0) r2 = 0.59 y = -91.6x + 47.8 0 .4 0 0 .4 5 0 .5 0 0 .5 5 0 .6 0 •In general, DOC concentrations were highest in basins with no or low alpine cover. •The basin with the highest DOC (Short Ck) had the greatest extent of valley bottom (5%), though this terrain attribute was a poor predictor of DOC. 1200 1400 1000 Sedimentary 1000 800 600 Mixed 400 200 Metamorphic 0 0 200 400 600 800 1000 1200 1400 1600 ANC (μeq L -1 ) 25.2 (10.0) 5 0 DOC - 71.2 80.2 90.9 79.7 96.6 88.2 94.5 106.0 99.7 113.1 86.8 (24.4) 15 10 0 .3 5 7.8 7.8 7.9 7.8 7.9 7.8 7.8 7.9 7.9 7.9 171.3 (79.0) 40 -5 1200 7.8 (0.3) 30 •Nitrate concentrations in the 5 basins with > 40% alpine cover are 10X higher than the other 13 basins. •Nitrate comprised 75 to 94% of the total dissolved nitrogen in the five high nitrate streams, but it was less than half of TDN in the others. •Exposed rock represents 13 to 37% of the basin area of the five high nitrate streams compared to less than half that in the remaining basins. •DON concentrations are 30% lower on average for the high nitrate streams. Mixed Parent Material Byers Mine Wyssen Lexen Short Iron Lunch Alder West St Louis Gordon Overall Mean SD 20 B a sin N D V I 4.9 (2.7) Streamwater Chemistry 1200 Exposed Rock in Alpine (%) Alpine Greenness 1000 800 Calcium (μeq L -1) Brightness, greenness, and wetness analyses are a product of the Tassel Cap Transformation based on PCA-like techniques. This procedure reduces the spectral dimensionality of the 7 Landsat TM bands into 3 bands that explain ~98% of the spectral variability. Brightness: Soil moisture dynamics (75% of variability) Greenness: Vegetation vigor without soil reflectance influences (15% of variability). Wetness: Soil/ canopy moisture relationships (8% of variability). Radiation: A unitless index of potential solar influence (0= high radiation to 1= high shade) from a raster algorithm and 10m DEM. NDVI: Normalized Difference Vegetation Index analysis is a ratio of red and near IR bands to assess chlorophyll and soil reflectance Ca Mg Na K pH EC ANC SO NO andBedrock index above ground biomass. Metamorphic 2+ 10 25 -1 The proportion of each study basin located above treeline ranges from 0 to 56%. The smallest basins did not extent above treeline, but there was no consistent relation between basin size and alpine cover. For example, several smaller basins situated near the upper portion of the St Louis Creek basin (e.g. Lunch, Gordon, and Mine Cks) had among the highest alpine cover. Exposed rock covers as much as 70% and averages 44% of the alpine area. Valley bottom covers about 2.5% of the basins on average. 20 A lp in e R o c k E x t e n t ( % ) 0 Terrain Analysis Calcium (μeq L ) N The 19 tributaries of St Louis Creek cover <10 to nearly 1000 ha with an average area of 315 ha. Individual tributaries span as much as 1000 m in elevation with an average of 624 m of relief. Treeline averages 3482 m elevation and ranges from 3242 to 3654 m. The individual tributaries are nested within the 8500 ha basin gauged by USGS St Louis Creek Station 09026500 located at 39°54'36" N, 105°52'40" W and 2735 m elevation (USGS 2008). Calcium (μeq L -1 ) Fraser Expt Forest -1 Nitrate (meq L ) St Louis Creek Basin -1 Nitrate (meq L ) 25 20 600 400 r2 = 0.71 y = 11.4x + 128 200 800 600 400 r2 = 0.84 y = -40.6x + 1956 200 0 0 0 20 40 60 80 20 25 30 35 40 •The pH of St Louis Creek tributaries averages 7.8 and ranges from 7.4 to 8.1 •Streamwater calcium and ANC are regulated by basin bedrock with differences between basins containing sandstone and shale, those formed on metamorphic material and basins with mixed geology. •The extent of exposed rock and the spectral greenness of the Alpine explain 71 and 84% of the variability of streamwater calcium, respectively and related similarly to ANC. 45
