CHEM 322 Name___________________________________ Exam
advertisement

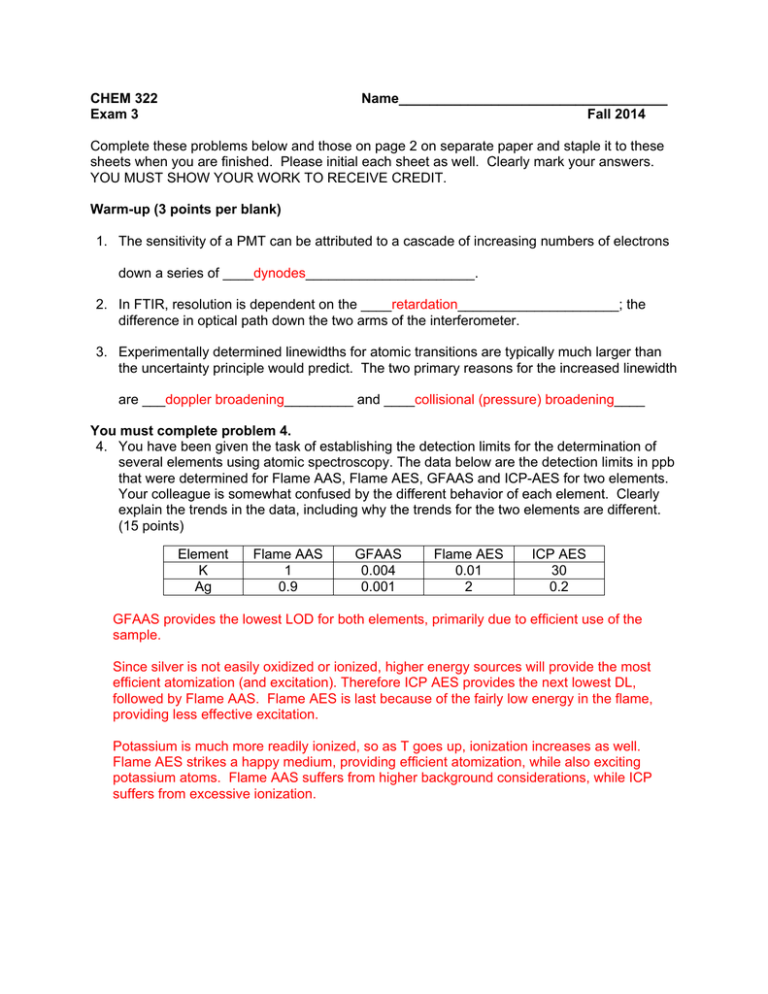
CHEM 322 Exam 3 Name___________________________________ Fall 2014 Complete these problems below and those on page 2 on separate paper and staple it to these sheets when you are finished. Please initial each sheet as well. Clearly mark your answers. YOU MUST SHOW YOUR WORK TO RECEIVE CREDIT. Warm-up (3 points per blank) 1. The sensitivity of a PMT can be attributed to a cascade of increasing numbers of electrons down a series of ____dynodes______________________. 2. In FTIR, resolution is dependent on the ____retardation_____________________; the difference in optical path down the two arms of the interferometer. 3. Experimentally determined linewidths for atomic transitions are typically much larger than the uncertainty principle would predict. The two primary reasons for the increased linewidth are ___doppler broadening_________ and ____collisional (pressure) broadening____ You must complete problem 4. 4. You have been given the task of establishing the detection limits for the determination of several elements using atomic spectroscopy. The data below are the detection limits in ppb that were determined for Flame AAS, Flame AES, GFAAS and ICP-AES for two elements. Your colleague is somewhat confused by the different behavior of each element. Clearly explain the trends in the data, including why the trends for the two elements are different. (15 points) Element K Ag Flame AAS 1 0.9 GFAAS 0.004 0.001 Flame AES 0.01 2 ICP AES 30 0.2 GFAAS provides the lowest LOD for both elements, primarily due to efficient use of the sample. Since silver is not easily oxidized or ionized, higher energy sources will provide the most efficient atomization (and excitation). Therefore ICP AES provides the next lowest DL, followed by Flame AAS. Flame AES is last because of the fairly low energy in the flame, providing less effective excitation. Potassium is much more readily ionized, so as T goes up, ionization increases as well. Flame AES strikes a happy medium, providing efficient atomization, while also exciting potassium atoms. Flame AAS suffers from higher background considerations, while ICP suffers from excessive ionization. Complete 5 of the following. Be concise in your answers and show work for problems involving calculations. Clearly indicate which problems are not to be graded. (15 pts ea) 5. In the development of Beer’s law, at least two assumptions must be made. Identify two assumptions that must be valid for a system to follow Beer’s law and describe the impact on a quantitative measurement should these assumptions fail. Beer’s law assumes that: Incident light is monochromatic, or at least the bandwidth of the incident light is much narrower than the absorption band that is to be excited. Under these conditions, the molar absorptivity is essentially independent of wavelength. As the bandwidth increases, molar absorptivity becomes strongly dependent on wavelength. This variation becomes even more pronounced as concentration (and absorbance) increases, causing Beer’s Law plots to bend toward the concentration axes as the apparent molar absorptivity decreases. ii. The system is not saturated in light so that a photon moving through the sample has some probability of being absorbed. iii. Absorbers behave independent of one another; otherwise the apparent molar absorptivity of the solution will vary with concentration. iv. Any equilibria present are static to that the composition of the solution does not change during the course of the measurement. i. 6. Why are atomic emission methods with an ICP source better suited for multi-element analysis than flame absorption methods? Include block diagrams of ICP-AES and Flame AAS instruments. In AAS, an external light source, such as a hollow cathode lamp, must be used to excite the atom of interest. Given that HC lamps provide narrow bandwidth excitation, and given that the absorption spectra for elements vary, multielement analysis by AA requires multiple excitation sources. In Plasma AES, the energy of the plasma is sufficient to excite the atoms in the sample, so the requirement for a separate excitation source is removed. Flame AAS Hollow Cathode Lamp Sample Flame Nebulizer Fuel Monchromator Detector Oxidant ICP-AES Sample Nebulizer ICP Argon Monchromator Detector 7. What role does the interferometer play in an FTIR instrument? How does it accomplish this role? How does the incorporation of an interferometer lead to the two primary advantages for doing Fourier transform spectroscopy? The role of the interferometer is to encode spectral information from the frequency domain to a domain that is easier to record experimentally. Your discussion should include a description of an interferometer and its operation. By recording how the light throughput through the interferometer changes as a function of moving mirror position (and ultimately difference in path length), the frequency-dependent signal (I as f(frequency) is encoded into the distance domain (I as f(retardation)). This dependence can then be decoded using a mathematical transform (like the FT). Since all wavelengths of light are being encoded simultaneously, the detector signal is larger, giving the throughput advantage. Because data for all wavelengths is recorded simultaneously and rapidly, to possibility for signal averaging exists, hence the multiplex advantage. 8. There is currently a great deal of interest in decreasing the size of traditional bench-top instruments, resulting in small, portable analytical devices. This is true for optical instruments as well, leading to the development of devices like the Ocean Optics spectrometers we use in several courses. Historically, the resolution for these small instruments is poorer than that for traditional bench-top devices. Discuss possible reasons for this observation. For convenience, you may want to consider “large” and “small” versions of the design at the right. Sample Source Detector Resolution of a grating-based instrument depends on the ability of the instrument to disperse light across the focal plane of the instrument. This dispersion is a result of the angular dispersion of the grating, the focal length of the monochromator and the width of the entrance and exit slits. As the size of the instrument decreases, the focal length goes down, decreasing the linear dispersion of the monochromator. So, to maintain high resolution, either the “quality” of the grating must be improved in order to produce greater angular and linear dispersion (which is costly), or the width of the slits must be decreased (which leads to low throughput and decreasing signal at the detector). 9. Describe how continuum-source background correction works in atomic absorption spectrometry. In this method the sample is alternately excited by a narrow band hollow cathode lamp and a continuum deuterium lamp. When the HC lamp is "on", the response at the detector is a combination of absorbance and background effects. Since the D2 continuum is so much broader than the absorbance band, the contribution of sample absorbance to the signal when the D2 lamp is "on" is minimal. The majority of the response is due to background. Thus comparing the two signals allows for compensation of background effects. 10. Sketch and label a block diagram for a fluorescence spectrometer. Why are high intensity sources like xenon arc lamps and lasers typically used in fluorescence experiments where deuterium lamps and tungsten lamps are adequate for most UV-VIS absorbance experiments? Continuum Light Source Excitation Monchromator Sample Emission Monchromator Detector The intensity of fluorescence is strongly dependent on the number of excited state species. Since this excitation is the result of absorbance of a photon, a greater number of photons incident on the sample will lead to stronger fluorescence. Absorbance measurements are actually more difficult with very intense sources, as you will be comparing small differences between relatively large numbers. 11. You have been instructed to build a UV-Vis instrument using a linear CCD array detector that has 1024 pixels aligned on a 2.00 cm chip. a. If you want the first order diffraction of light from 200-800 nm to completely fill the array, how many grooves per millimeter should his grating have? Assume the focal length of the monochromator is 0.20 m. In order for the wavelengths to span a 2.00 cm CCD, the reciprocal linear dispersion must be: D-1 = (800-200)nm/2.00 cm = 300 nm/cm Based on the relationship D-1 = d/nF, you can calculate the spacing between lines: d = nFD-1 = (1)(20 cm)(300 nm/cm) = 6000 nm/line This translates to a number of rulings per millimeter of: 1 line 6000 nm x 1 nm 10-6 mm = 167 lines mm b. If you were building a scanning spectrometer using the grating from part a, what slit width would be required to produce the same effective bandwidth as in the CCD instrument? Could the two emission lines of hydrogen (656.28 and 656.10 nm) be resolved using under these conditions? In using the CCD, each pixel in the array will sample (600 nm/1024 pixels) = 0.586 nm of the spectrum. To build a scanning spectrometer, this value would define the bandwidth of the instrument (eff). w = = 0.586 nm = 0.00195 cm = eff 19.5 m D-1 300 nm/cm In order to resolve the two lines, we need a of 0.18 nm. Since the effective bandwidth of the instrument is 0.59 nm, we would not be able to resolve the lines. Possibly Useful Information 1sin1 = 2sin2 eff = wD-1 D dr n d d cos r D-1 = 1/D T = P/P0 A = -logT = log(P0/P) = bc E nN n = d(sin i + sin r) dr dy F d d 1 2 R 1 hc h k = 1.38 x 10⁻²³ JK-1 E hc g E / kT N e N0 g 0 c = 3.00 x 10⁸ ms-1 Planck's Constant = 6.63 x 10⁻³⁴ Js AAS = Atomic absorption spectrophotometry AES = Atomic emission spectrophotometry ICP = Inductively coupled plasma


