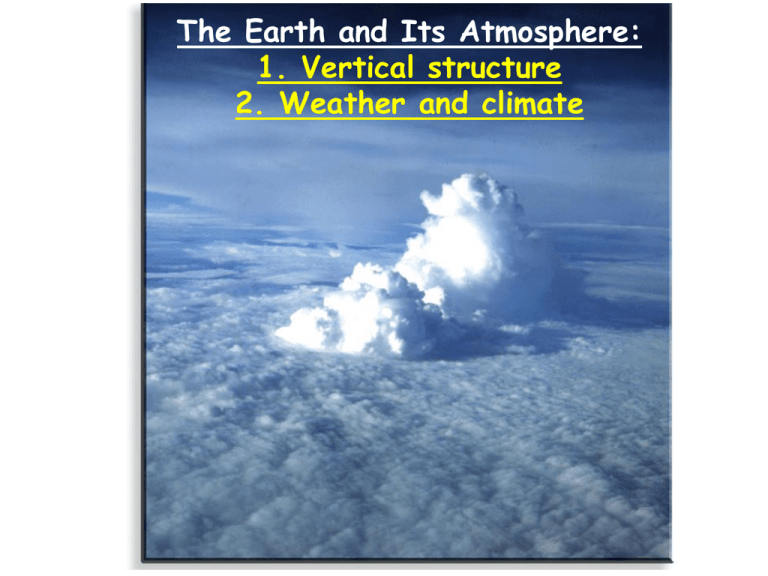
The Earth and Its Atmosphere: 1. Vertical structure 2. Weather and climate
advertisement
The Earth and Its Atmosphere: 1. Vertical structure 2. Weather and climate Mass,Weight, Density, Pressure • • • • Mass M: ♦ property of matter, ♦ SI unit: kg. Other units: 1kg=1000 g, 1 lb=450 g W Weight : ♦ a force, has a magnitude and direction (vector). ♦ weight = mass x gravity g(Earth)= 9.78 m/s2 ♦ SI unit: kg m/s2 -> N g(Mars)= 3.7 m/s2 Density r: ♦ mass per unit volume: density = mass / volume ♦ SI unit: kg/m3, Other: g/cm3 Pressure p: ♦ p= force/area ♦ SI units: Pa=N/m2, Other: 1bar=100 Pa Atmospheric pressure Atmospheric pressure and density decrease with altitude exponentially!!! • RECAP Atmospheric composition: • Permanent gases: N2, O2, Ar, Xe, Ne, H2, He • Variable gases: CO2,H2O,O3,CH4 Greenhouse gases: H2O, CO2, NO,CH4 • • • Weight. • • • The atmospheric pressure and Mass. Density. Pressure. density decrease with altitude. Mid-chapter brief review(s) • The earth’s atmosphere is a mixture of many gases. In a volume of dry air near the surface, nitrogen (N ) occupies about 78 percent and • • • • • 2 oxygen (O2) about 21 percent. Water vapor, which normally occupies less than 4 percent in a volume of air near the surface, can condense into liquid cloud droplets or transform into delicate ice crystals. Water is the only substance in our atmosphere that is found naturally as a gas (water vapor), as a liquid (water) and as a solid (ice). Both water vapor and carbon dioxide (CO2) are important greenhouse gases. Ozone (O3) in the stratosphere protects life from harmful ultraviolet (UV) radiation. At the surface, ozone is the main ingredient of photochemical smog. The majority of water on our planet is believed to have come from its hot interior through outgassing. ? ? Atmospheric pressure at any level represents the total mass of air above that level, and atmospheric pressure always decreases with increasing height above the surface. Vertical Structure of the Earth’s Atmosphere 99.9% 90% Lapse rate Atmospheric layers (according to the temperature) • Troposphere: ♦ The temperature T decreases with height at a rate of 6.5 K/km. • • •• •• ♦ Well mixed as a result of turbulence and convection ♦ Weather phenomena Tropopause: ♦ Isothermal (T constant) ♦ Located 8-15 km above the ground. Stratosphere: ♦ The temperature T increases with height ♦ O3 layer at 25 km altitude ♦ The atmosphere is very stable Stratopause: T=const Mesosphere: ♦ T is decreasing with height: effective cooling through IR emission ♦ Very unhealthy region: hypoxia (oxygen deprivation), UV burns, blood begins to boil Mesopause: the coldest region on Earth. Thermosphere: fast T increase. Diffusive separation of gases. Atmospheric layers: other classifications • Mixing: ♦ Homosphere: well mixed, the chemical composition is constant. ♦ Heterosphere: no turbulence and mixing, diffusive separation of gases Ionization: ♦ Ionosphere: part of the atmospheric gas is ionized through photo ionization or impact ionization. ♦ (talk about the atom) • • • • • • • • Weather/ Climate Weather elements: ♦ Air temperature: thermometer (C, F, K) ♦ Air pressure: barometer (bar, mbar) ♦ Humidity: hygrometer (%) ♦ Wind: (m/s , km/h, mi/h) ♦ Clouds ♦ Precipitation ♦ Visibility Weather: the daily variations of the atmospheric conditions. “It is partly cloudy today, with a 50% chance of rain” Climate: average weather. “The average maximum temperature for the month of January is 35 F.” Weather Forecasting Using Satellites isobar streamline isotherm The World Jupiter as seen from Cassini Meteorology – a brief history • Meteorology is the study of the atmosphere and its phenomena • In “Meteorologica” (340 B.C.) Aristotle discussed • • • • • • • ♦ meteors (things which fall from the sky) ♦ weather and climate, astronomy, geography… ♦ clouds, rain, snow, wind, hail, thunder, hurricanes… Invention of weather instruments in the Middle Ages ♦ Pressure: barometer (1643, E. Torricelli) ♦ Humidity: hygrometer (1783, H. de Saussure) Rapid exchange of weather information (telegraph, 1843) Crude weather maps (1869) Norwegian model of storm development (1920’s) Air balloon and high-flying aircraft observations (1940) High-speed computers and numerical predictions (1950-) Weather satellites (1960-) Aristotle de Saussure Simplified surface weather map Weather phenomena: a preview Clouds and thunderstorms Ice storm Tornadoes Flooding
