Document 10439259
advertisement
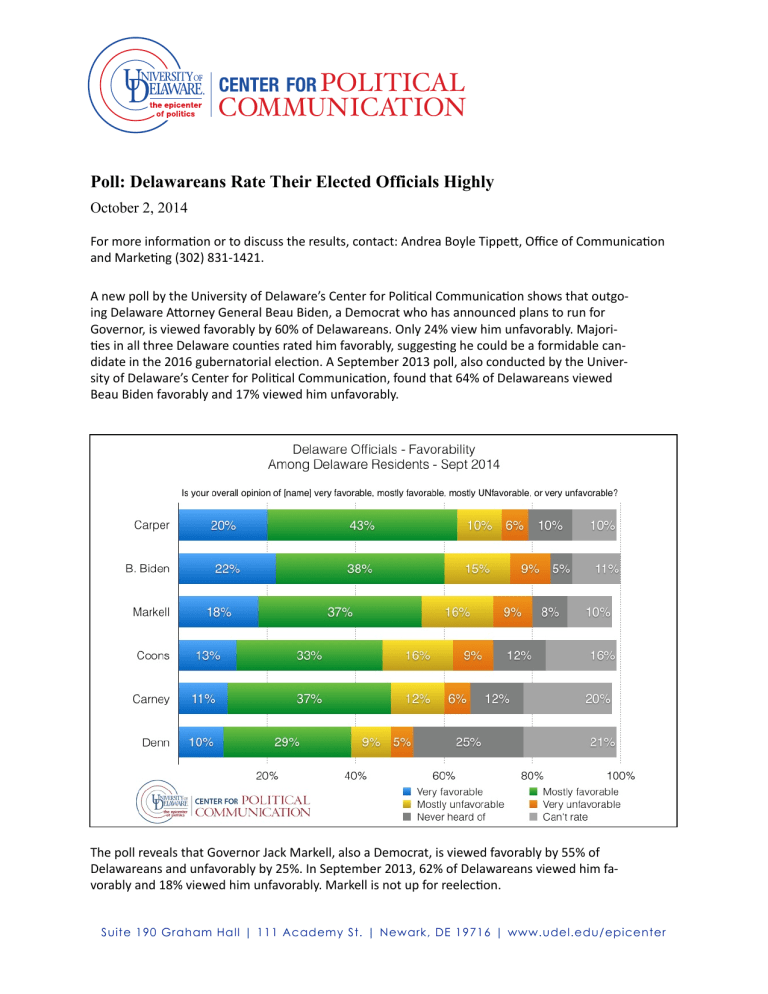
CENTER FOR CENTER FOR !"#$%$&'# ! &"(()*$&'%$"* ! ! ! Poll: Delawareans Rate Their Elected Officials Highly October 2, 2014 For more informa+on or to discuss the results, contact: Andrea Boyle Tippe:, Office of Communica+on and Marke+ng (302) 831-­‐1421. ! A new poll by the University of Delaware’s Center for Poli+cal Communica+on shows that outgo-­‐ ing Delaware A:orney General Beau Biden, a Democrat who has announced plans to run for Governor, is viewed favorably by 60% of Delawareans. Only 24% view him unfavorably. Majori-­‐ +es in all three Delaware coun+es rated him favorably, sugges+ng he could be a formidable can-­‐ didate in the 2016 gubernatorial elec+on. A September 2013 poll, also conducted by the Univer-­‐ sity of Delaware’s Center for Poli+cal Communica+on, found that 64% of Delawareans viewed Beau Biden favorably and 17% viewed him unfavorably. University of Delaware | Elliott Hall | 26 East Main Street | Newark, DE 19716 | www.udel.edu/epicenter ! The poll reveals that Governor Jack Markell, also a Democrat, is viewed favorably by 55% of Delawareans and unfavorably by 25%. In September 2013, 62% of Delawareans viewed him fa-­‐ vorably and 18% viewed him unfavorably. Markell is not up for reelec+on. Suite 190 Graham Hall | 111 Academy St. | Newark, DE 19716 | www.udel.edu/epicenter CENTER FOR POLITICAL COMMUNICATION University of Delaware ! ! Lt. Gov. Ma: Denn, a Democrat who is running for A:orney General in next month’s elec+on, is viewed favorably by 39% of Delawareans and unfavorably by 13%, giving him an almost a three-­‐ to-­‐one margin among those who provided a ra+ng of him. However, 46% of Delawareans said they had never heard of him or could not rate him. The 2013 poll did not ask about Denn. ! The poll shows that Senator Tom Carper, a Democrat, remains the most popular member of Del-­‐ aware’s Congressional delega+on. Fully 63% of Delawareans view him favorably, while 16% view him unfavorably. Senator Chris Coons, a Democrat who is running for reelec+on next month, is viewed favorably by 45% and unfavorably by 26%. Representa+ve John Carney, another Democ-­‐ rat who is currently running for reelec+on, is viewed favorably by 49% and unfavorably by 17%. Favorably ra+ngs for Carper, Coons, and Carney have changed li:le from September 2013. ! If the next presiden+al elec+on were held today, either former Secretary of State Hillary Clinton or Vice President Joe Biden would handily defeat New Jersey Governor Chris Chris+e in Del-­‐ aware. Both Biden and Chris+e are University of Delaware alumni, but if they ran head-­‐to-­‐head in Delaware, Biden would crush Chris+e, 54% to 38%. ! Most Delawareans hold posi+ve views of both Hillary Clinton and Joe Biden. Fully 64% view the Vice President favorably, and 61% view Clinton favorably. Their ra+ngs have changed li:le from September 2013. In contrast, Chris+e’s favorability has declined 13 points in the past year, from 57% to 44%. Even so, Delawareans s+ll view Chris+e more favorably than two other poten+al page 2 CENTER FOR POLITICAL COMMUNICATION page 3 University of Delaware ! Republican presiden+al contenders. Only 29% of Delaware residents view former Florida Gover-­‐ nor Jeb Bush favorably, and just 26% view Senator Rand Paul of Kentucky favorably. ! About the study ! The Na+onal Agenda Opinion Project research was funded by the University of Delaware’s Center for Poli+cal Communica+on (CPC) and the William P. Frank Founda+on. The study was supervised by the CPC’s Associate Director, Paul Brewer, a professor in the Departments of Communica+on and Poli+cal Science & Interna+onal Rela+ons. ! Results are based on telephone interviews with a representa+ve sample of 902 adults residing in the state of Delaware. Telephone interviews were conducted via landline (n=450) and cell phone (n=452 in-­‐ cluding 190 without a landline phone). The survey was conducted by Princeton Survey Research As-­‐ sociates Interna+onal, and the interviews were administered in English by Princeton Data Source . The data were collected from September 10 -­‐ 22, 2014. Sta+s+cal results are weighted to correct known de-­‐ mographic discrepancies. The margin of sampling error for the complete set of weighted data is ± 3.9 percentage points. Results for the Clinton vs. Chris+e and Biden vs. Chris+e ques+ons were based on half samples. Results based on subsamples have larger margins of error. Some totals in the text differ slightly from the percentages in the tables and figures due to rounding. ! Readers should be aware that in addi+on to sampling error, ques+on wording and prac+cal difficul+es in conduc+ng surveys can introduce error or bias into the findings of public opinion polls. ! Please contact Paul Brewer at (302) 831-­‐7771 for more details about the survey’s methodology. CENTER FOR POLITICAL COMMUNICATION page 4 University of Delaware ! ! ! UNIVERSITY OF DELAWARE CENTER FOR POLITICAL COMMUNICATION SEPTEMBER 2014 NATIONAL AGENDA POLL FINAL TOPLINE September 10-­‐22, 2014 N = 902 DE Residents Is your overall opinion of Governor Jack Markell very favorable, mostly favorable, mostly UNfavorable, or very unfavorable? 2014 DE Residents 2013 DE Residents Very favorable 18% 19% Mostly favorable 37% 43% Mostly unfavorable 16% 11% Very unfavorable 9% 7% Never heard of (volunteered) 8% 9% Can’t rate (volunteered) 10% 11% Refused (volunteered) 1% 1% 100% 100% TOTAL ! ! Is your overall opinion of Lieutenant Governor Ma: Denn very favorable, mostly favorable, mostly UNfa-­‐ vorable, or very unfavorable? 2014 DE Residents Very favorable 10% Mostly favorable 29% Mostly unfavorable 9% Very unfavorable 5% Never heard of (volunteered) 25% Can’t rate (volunteered) 21% Refused (volunteered) 1% TOTAL ! ! 100% CENTER FOR POLITICAL COMMUNICATION page 5 University of Delaware ! Is your overall opinion of State A:orney General Beau Biden very favorable, mostly favorable, mostly UNfavorable, or very unfavorable? 2014 DE Residents 2013 DE Residents Very favorable 22% 24% Mostly favorable 38% 41% Mostly unfavorable 15% 9% Very unfavorable 9% 8% Never heard of (volunteered) 5% 7% Can’t rate (volunteered) 11% 12% Refused (volunteered) 1% 0% 100% 100% TOTAL ! ! Is your overall opinion of Senator Chris Coons very favorable, mostly favorable, mostly UNfavorable, or very unfavorable? 2014 DE Residents 2013 DE Residents Very favorable 13% 13% Mostly favorable 33% 34% Mostly unfavorable 16% 15% Very unfavorable 9% 9% Never heard of (volunteered) 12% 15% Can’t rate (volunteered) 16% 15% Refused (volunteered) 2% 0% 100% 100% TOTAL ! ! Is your overall opinion of Senator Tom Carper very favorable, mostly favorable, mostly UNfavorable, or very unfavorable? 2014 DE Residents 2013 DE Residents Very favorable 20% 21% Mostly favorable 43% 40% Mostly unfavorable 10% 13% Very unfavorable 6% 6% Never heard of (volunteered) 10% 10% Can’t rate (volunteered) 10% 9% Refused (volunteered) 1% 0% 100% 100% TOTAL ! ! CENTER FOR POLITICAL COMMUNICATION page 6 University of Delaware ! Is your overall opinion of Representa+ve John Carney very favorable, mostly favorable, mostly UNfavor-­‐ able, or very unfavorable? 2014 DE Residents 2013 DE Residents Very favorable 11% 11% Mostly favorable 37% 36% Mostly unfavorable 12% 13% Very unfavorable 6% 6% Never heard of (volunteered) 12% 17% Can’t rate (volunteered) 20% 17% Refused (volunteered) 2% 0% 100% 100% TOTAL ! ! Is your overall opinion of Barack Obama very favorable, mostly favorable, mostly UNfavorable, or very unfavorable? 2014 DE Residents 2013 DE Residents Very favorable 26% 29% Mostly favorable 28% 31% Mostly unfavorable 19% 13% Very unfavorable 24% 21% Never heard of (volunteered) 0% 0% Can’t rate (volunteered) 2% 5% Refused (volunteered) 1% 1% 100% 100% TOTAL ! ! Is your overall opinion of Joe Biden very favorable, mostly favorable, mostly UNfavorable, or very unfa-­‐ vorable? 2014 DE Residents 2013 DE Residents Very favorable 30% 30% Mostly favorable 34% 35% Mostly unfavorable 15% 13% Very unfavorable 15% 15% Never heard of (volunteered) 1% 3% Can’t rate (volunteered) 4% 4% Refused (volunteered) 1% 0% 100% 100% TOTAL ! ! CENTER FOR POLITICAL COMMUNICATION page 7 University of Delaware ! Is your overall opinion of Hillary Clinton very favorable, mostly favorable, mostly UNfavorable, or very unfavorable? 2014 DE Residents 2013 DE Residents Very favorable 25% 28% Mostly favorable 36% 37% Mostly unfavorable 16% 13% Very unfavorable 17% 15% Never heard of (volunteered) 1% 1% Can’t rate (volunteered) 4% 6% Refused (volunteered) 1% 0% 100% 100% TOTAL ! Is your overall opinion of Chris Chris+e very favorable, mostly favorable, mostly UNfavorable, or very un-­‐ favorable? 2014 DE Residents 2013 DE Residents Very favorable 11% 17% Mostly favorable 33% 40% Mostly unfavorable 22% 16% Very unfavorable 13% 8% Never heard of (volunteered) 8% 7% Can’t rate (volunteered) 11% 12% Refused (volunteered) 2% 0% 100% 100% TOTAL ! ! Is your overall opinion of Rand Paul very favorable, mostly favorable, mostly UNfavorable, or very unfa-­‐ vorable? 2014 DE Residents Very favorable 5% Mostly favorable 21% Mostly unfavorable 19% Very unfavorable 15% Never heard of (volunteered) 24% Can’t rate (volunteered) 15% Refused (volunteered) 2% TOTAL ! ! ! 100% CENTER FOR POLITICAL COMMUNICATION page 8 University of Delaware ! Is your overall opinion of Jeb Bush very favorable, mostly favorable, mostly UNfavorable, or very unfa-­‐ vorable? 2014 DE Residents Very favorable 5% Mostly favorable 24% Mostly unfavorable 23% Very unfavorable 18% Never heard of (volunteered) 15% Can’t rate (volunteered) 15% Refused (volunteered) 2% TOTAL ! 100% If the 2016 presiden+al elec+on were being held today and the candidates were [ROTATE: Hillary Clinton the Democrat and Chris Chris+e the Republican], who would you vote for? (N = 440 for 2014) 2014 DE Residents 2013 DE Residents Hillary Clinton 54% 53% Chris Chris+e 33% 36% Neither/Other candidate (volunteered) 8% 7% Don’t know/refused (volunteered) 5% 4% 100% 100% TOTAL ! If the 2016 presiden+al elec+on were being held today and the candidates were [ROTATE: Joe Biden the Democrat and Chris Chris+e the Republican], who would you vote for? (N = 440 for 2014) 2014 DE Residents 2013 DE Residents Joe Biden 54% 53% Chris Chris+e 38% 34% Neither/Other candidate (volunteered) 5% 8% Don’t know/refused (volunteered) 3% 5% 100% 100% TOTAL ! In poli+cs today, do you consider yourself a Republican, Democrat, or Independent? 2014 DE Residents 2013 DE Residents Republican 22% 22% Democrat 36% 40% Independent 37% 34% No preference (volunteered) 3% 3% Other party (volunteered) 0% 0% Don’t know/refused (volunteered) 2% 1% 100% 100% TOTAL CENTER FOR POLITICAL COMMUNICATION page 9 University of Delaware ! DETAILED DEMOGRAPHIC TABLES ! Is your overall opinion of Governor Jack Markell very favorable, mostly favorable, mostly UNfavorable, or very unfavorable? Very Fa-­‐ vorable Mostly favorable Mostly un-­‐ favorable Very unfa-­‐ vorable Never heard of Can’t rate Refused Men 17% 37% 17% 12% 7% 9% 1% Women 19% 38% 15% 7% 8% 12% 1% Republicans 10% 35% 26% 17% 2% 9% 2% Democrats 27% 42% 9% 3% 10% 9% 0% Independents 15% 37% 18% 11% 8% 10% 1% Kent 20% 28% 19% 14% 8% 10% 0% New Castle 19% 39% 14% 9% 9% 10% 1% Sussex 15% 41% 20% 8% 5% 11% 1% GENDER PARTY COUNTY ! ! ! Is your overall opinion of Lieutenant Governor Ma: Denn very favorable, mostly favorable, mostly UNfa-­‐ vorable, or very unfavorable? Very Fa-­‐ vorable Mostly favorable Mostly un-­‐ favorable Very unfa-­‐ vorable Never heard of Can’t rate Refused Men 11% 30% 10% 6% 21% 20% 1% Women 10% 28% 7% 4% 29% 21% 1% Republicans 8% 29% 15% 5% 17% 26% 1% Democrats 15% 28% 4% 3% 32% 17% 1% Independents 7% 32% 10% 6% 21% 22% 2% Kent 12% 29% 10% 8% 25% 14% 1% New Castle 11% 28% 8% 6% 27% 19% 2% Sussex 8% 31% 9% 2% 21% 29% 1% GENDER PARTY COUNTY CENTER FOR POLITICAL COMMUNICATION page 10 University of Delaware ! ! ! Is your overall opinion of State A:orney General Beau Biden very favorable, mostly favorable, mostly UNfavorable, or very unfavorable? Very Fa-­‐ vorable Mostly favorable Mostly un-­‐ favorable Very unfa-­‐ vorable Never heard of Can’t rate Refused Men 18% 40% 18% 11% 3% 9% 1% Women 25% 37% 12% 7% 6% 12% 1% Republicans 10% 31% 32% 15% 2% 9% 2% Democrats 36% 39% 6% 6% 4% 9% 1% Independents 16% 43% 15% 9% 5% 10% 2% Kent 18% 35% 16% 15% 5% 8% 3% New Castle 23% 38% 14% 8% 6% 11% 1% Sussex 20% 44% 15% 6% 2% 11% 2% GENDER PARTY COUNTY ! ! Is your overall opinion of Senator Chris Coons very favorable, mostly favorable, mostly UNfavorable, or very unfavorable? Very Fa-­‐ vorable Mostly favorable Mostly un-­‐ favorable Very unfa-­‐ vorable Never heard of Can’t rate Refused Men 11% 35% 19% 12% 11% 12% 1% Women 14% 31% 14% 7% 12% 20% 2% Republicans 4% 31% 22% 15% 9% 17% 2% Democrats 24% 33% 11% 7% 10% 13% 2% Independents 7% 33% 19% 9% 12% 18% 1% Kent 10% 30% 16% 12% 10% 17% 5% New Castle 13% 36% 17% 10% 10% 14% 1% Sussex 13% 26% 16% 7% 17% 21% 1% GENDER PARTY COUNTY CENTER FOR POLITICAL COMMUNICATION page 11 University of Delaware ! Is your overall opinion of Senator Tom Carper very favorable, mostly favorable, mostly UNfavorable, or very unfavorable? Very Fa-­‐ vorable Mostly favorable Mostly un-­‐ favorable Very unfa-­‐ vorable Never heard of Can’t rate Refused Men 16% 48% 10% 8% 9% 8% 2% Women 24% 38% 11% 3% 10% 13% 1% Republicans 15% 41% 19% 10% 5% 10% 1% Democrats 30% 41% 6% 2% 10% 9% 2% Independents 14% 48% 10% 6% 11% 10% 2% Kent 22% 40% 7% 5% 12% 10% 5% New Castle 21% 42% 11% 6% 10% 9% 1% Sussex 15% 46% 11% 7% 6% 13% 2% GENDER PARTY COUNTY ! ! Is your overall opinion of Representa+ve John Carney very favorable, mostly favorable, mostly UNfavor-­‐ able, or very unfavorable? Very Fa-­‐ vorable Mostly favorable Mostly un-­‐ favorable Very unfa-­‐ vorable Never heard of Can’t rate Refused Men 12% 39% 15% 7% 10% 16% 2% Women 11% 36% 8% 4% 15% 24% 3% Republicans 4% 34% 19% 10% 8% 23% 2% Democrats 20% 40% 6% 3% 12% 17% 2% Independents 8% 38% 13% 5% 14% 20% 2% Kent 10% 36% 15% 7% 8% 17% 7% New Castle 12% 38% 10% 6% 14% 19% 1% Sussex 10% 36% 15% 4% 11% 24% 1% GENDER PARTY COUNTY ! ! CENTER FOR POLITICAL COMMUNICATION page 12 University of Delaware ! Is your overall opinion of Barack Obama very favorable, mostly favorable, mostly UNfavorable, or very unfavorable? ! Very Fa-­‐ vorable Mostly favorable Mostly un-­‐ favorable Very unfa-­‐ vorable Never heard of Can’t rate Refused Men 23% 29% 19% 28% 0% 1% 0% Women 28% 28% 20% 20% 0% 3% 1% Republicans 4% 11% 36% 48% 0% 0% 1% Democrats 49% 36% 6% 5% 1% 3% 0% Independents 15% 31% 23% 27% 27% 2% 1% Kent 18% 21% 31% 27% 0% 2% 2% New Castle 29% 31% 16% 20% 0% 3% 1% Sussex 22% 27% 19% 30% 1% 1% 1% GENDER PARTY ! COUNTY ! Is your overall opinion of Joe Biden very favorable, mostly favorable, mostly UNfavorable, or very unfa-­‐ vorable? Very Fa-­‐ vorable Mostly favorable Mostly un-­‐ favorable Very unfa-­‐ vorable Never heard of Can’t rate Refused Men 27% 35% 17% 17% 1% 3% 1% Women 33% 34% 13% 13% 1% 6% 1% Republicans 10% 22% 29% 32% 0% 5% 1% Democrats 49% 37% 4% 3% 2% 5% 0% Independents 25% 38% 17% 16% 1% 2% 1% Kent 23% 30% 21% 20% 0% 3% 2% New Castle 34% 33% 14% 12% 2% 6% 0% Sussex 25% 40% 14% 18% 2% 2% 0% GENDER PARTY COUNTY ! ! CENTER FOR POLITICAL COMMUNICATION page 13 University of Delaware ! Is your overall opinion of Hillary Clinton very favorable, mostly favorable, mostly UNfavorable, or very unfavorable? Very Fa-­‐ vorable Mostly favorable Mostly un-­‐ favorable Very unfa-­‐ vorable Never heard of Can’t rate Refused Men 20% 36% 19% 20% 1% 3% 1% Women 30% 35% 14% 13% 1% 5% 2% Republicans 8% 25% 31% 36% 0% 1% 1% Democrats 43% 41% 5% 3% 2% 6% 1% Independents 17% 39% 19% 19% 1% 4% 2% Kent 16% 29% 23% 22% 2% 5% 3% New Castle 29% 35% 15% 14% 1% 5% 1% Sussex 21% 41% 16% 19% 1% 2% 1% GENDER PARTY COUNTY ! ! ! Is your overall opinion of Chris Chris+e very favorable, mostly favorable, mostly UNfavorable, or very un-­‐ favorable? ! Very Fa-­‐ vorable Mostly favorable Mostly un-­‐ favorable Very unfa-­‐ vorable Never heard of Can’t rate Refused Men 10% 36% 23% 13% 7% 7% 4% Women 12% 30% 20% 14% 9% 14% 1% Republicans 16% 43% 19% 7% 5% 8% 3% Democrats 9% 25% 26% 18% 10% 11% 1% Independents 11% 34% 21% 12% 8% 11% 3% Kent 17% 28% 17% 14% 8% 14% 3% New Castle 11% 34% 24% 14% 7% 8% 2% Sussex 8% 32% 21% 12% 12% 14% 2% GENDER PARTY COUNTY CENTER FOR POLITICAL COMMUNICATION page 14 University of Delaware ! Is your overall opinion of Rand Paul very favorable, mostly favorable, mostly UNfavorable, or very unfa-­‐ vorable? Very Fa-­‐ vorable Mostly favorable Mostly un-­‐ favorable Very unfa-­‐ vorable Never heard of Can’t rate Refused Men 7% 26% 19% 16% 18% 13% 1% Women 3% 17% 18% 13% 29% 17% 2% Republicans 7% 35% 15% 9% 16% 15% 3% Democrats 4% 12% 21% 24% 28% 11% 1% Independents 5% 23% 20% 11% 22% 18% 1% Kent 4% 29% 10% 21% 22% 12% 3% New Castle 5% 19% 23% 14% 23% 16% 1% Sussex 6% 22% 15% 13% 27% 15% 2% GENDER PARTY COUNTY ! ! Is your overall opinion of Jeb Bush very favorable, mostly favorable, mostly UNfavorable, or very unfa-­‐ vorable? Very Fa-­‐ vorable Mostly favorable Mostly un-­‐ favorable Very unfa-­‐ vorable Never heard of Can’t rate Refused Men 5% 28% 21% 19% 13% 13% 2% Women 5% 20% 24% 17% 16% 16% 2% Republicans 10% 41% 17% 7% 9% 15% 1% Democrats 3% 13% 31% 27% 14% 12% 1% Independents 5% 26% 20% 15% 16% 16% 2% Kent 5% 22% 22% 19% 13% 16% 5% New Castle 4% 24% 25% 17% 15% 15% 1% Sussex 7% 27% 18% 19% 15% 13% 2% GENDER PARTY COUNTY ! ! ! ! CENTER FOR POLITICAL COMMUNICATION page 15 University of Delaware ! If the 2016 presiden+al elec+on were being held today and the candidates were [ROTATE: Hillary Clinton the Democrat and Chris Chris+e the Republican], who would you vote for? (N = 440 for 2014) Hillary Clinton Chris Chris+e Neither/Other Don’t know/Refused Men 52% 34% 9% 5% Women 56% 32% 8% 5% Republicans 26% 65% 5% 3% Democrats 83% 9% 4% 4% Independents 46% 39% 9% 7% Kent 42% 40% 13% 5% New Castle 59% 31% 5% 6% Sussex 51% 34% 12% 3% GENDER PARTY COUNTY ! ! ! If the 2016 presiden+al elec+on were being held today and the candidates were [ROTATE: Joe Biden the Democrat and Chris Chris+e the Republican], who would you vote for? (N = 440 for 2014) Joe Biden Chris Chris+e Neither/Other Don’t know/Refused Men 48% 45% 6% 1% Women 60% 31% 4% 4% Republicans 16% 77% 5% 2% Democrats 84% 11% 3% 2% Independents 52% 39% 5% 4% Kent 41% 51% 1% 6% New Castle 55% 37% 5% 2% Sussex 62% 29% 8% 2% GENDER PARTY COUNTY
