Detecting proximity from personal audio recordings
advertisement
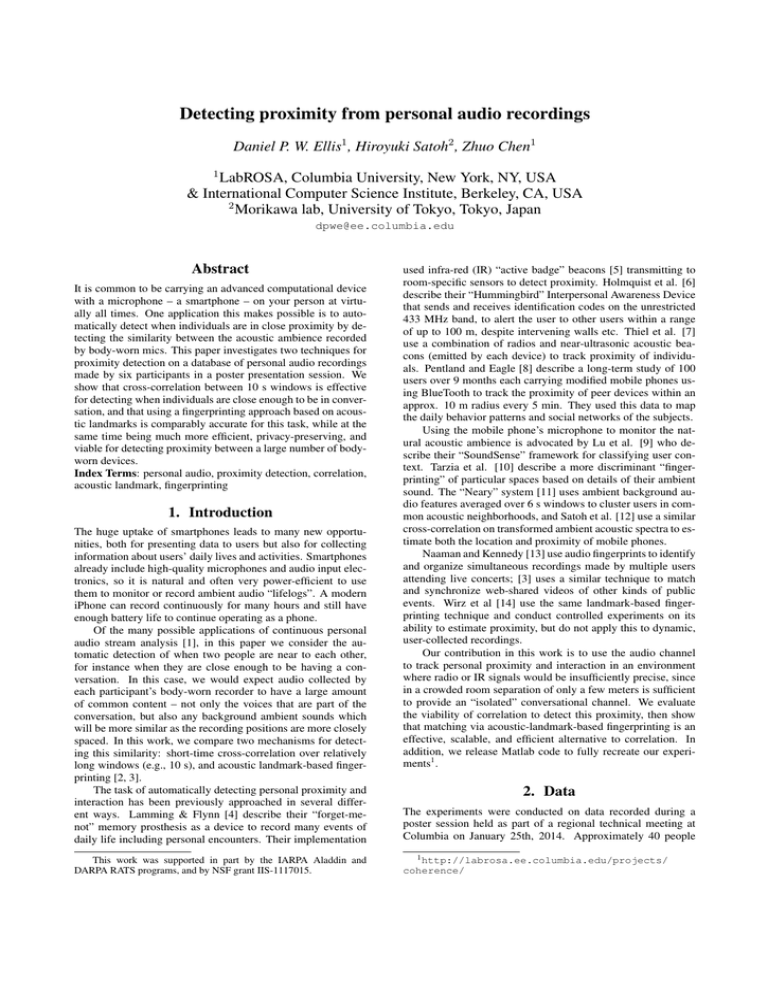
Detecting proximity from personal audio recordings Daniel P. W. Ellis1 , Hiroyuki Satoh2 , Zhuo Chen1 1 LabROSA, Columbia University, New York, NY, USA & International Computer Science Institute, Berkeley, CA, USA 2 Morikawa lab, University of Tokyo, Tokyo, Japan dpwe@ee.columbia.edu Abstract It is common to be carrying an advanced computational device with a microphone – a smartphone – on your person at virtually all times. One application this makes possible is to automatically detect when individuals are in close proximity by detecting the similarity between the acoustic ambience recorded by body-worn mics. This paper investigates two techniques for proximity detection on a database of personal audio recordings made by six participants in a poster presentation session. We show that cross-correlation between 10 s windows is effective for detecting when individuals are close enough to be in conversation, and that using a fingerprinting approach based on acoustic landmarks is comparably accurate for this task, while at the same time being much more efficient, privacy-preserving, and viable for detecting proximity between a large number of bodyworn devices. Index Terms: personal audio, proximity detection, correlation, acoustic landmark, fingerprinting 1. Introduction The huge uptake of smartphones leads to many new opportunities, both for presenting data to users but also for collecting information about users’ daily lives and activities. Smartphones already include high-quality microphones and audio input electronics, so it is natural and often very power-efficient to use them to monitor or record ambient audio “lifelogs”. A modern iPhone can record continuously for many hours and still have enough battery life to continue operating as a phone. Of the many possible applications of continuous personal audio stream analysis [1], in this paper we consider the automatic detection of when two people are near to each other, for instance when they are close enough to be having a conversation. In this case, we would expect audio collected by each participant’s body-worn recorder to have a large amount of common content – not only the voices that are part of the conversation, but also any background ambient sounds which will be more similar as the recording positions are more closely spaced. In this work, we compare two mechanisms for detecting this similarity: short-time cross-correlation over relatively long windows (e.g., 10 s), and acoustic landmark-based fingerprinting [2, 3]. The task of automatically detecting personal proximity and interaction has been previously approached in several different ways. Lamming & Flynn [4] describe their “forget-menot” memory prosthesis as a device to record many events of daily life including personal encounters. Their implementation This work was supported in part by the IARPA Aladdin and DARPA RATS programs, and by NSF grant IIS-1117015. used infra-red (IR) “active badge” beacons [5] transmitting to room-specific sensors to detect proximity. Holmquist et al. [6] describe their “Hummingbird” Interpersonal Awareness Device that sends and receives identification codes on the unrestricted 433 MHz band, to alert the user to other users within a range of up to 100 m, despite intervening walls etc. Thiel et al. [7] use a combination of radios and near-ultrasonic acoustic beacons (emitted by each device) to track proximity of individuals. Pentland and Eagle [8] describe a long-term study of 100 users over 9 months each carrying modified mobile phones using BlueTooth to track the proximity of peer devices within an approx. 10 m radius every 5 min. They used this data to map the daily behavior patterns and social networks of the subjects. Using the mobile phone’s microphone to monitor the natural acoustic ambience is advocated by Lu et al. [9] who describe their “SoundSense” framework for classifying user context. Tarzia et al. [10] describe a more discriminant “fingerprinting” of particular spaces based on details of their ambient sound. The “Neary” system [11] uses ambient background audio features averaged over 6 s windows to cluster users in common acoustic neighborhoods, and Satoh et al. [12] use a similar cross-correlation on transformed ambient acoustic spectra to estimate both the location and proximity of mobile phones. Naaman and Kennedy [13] use audio fingerprints to identify and organize simultaneous recordings made by multiple users attending live concerts; [3] uses a similar technique to match and synchronize web-shared videos of other kinds of public events. Wirz et al [14] use the same landmark-based fingerprinting technique and conduct controlled experiments on its ability to estimate proximity, but do not apply this to dynamic, user-collected recordings. Our contribution in this work is to use the audio channel to track personal proximity and interaction in an environment where radio or IR signals would be insufficiently precise, since in a crowded room separation of only a few meters is sufficient to provide an “isolated” conversational channel. We evaluate the viability of correlation to detect this proximity, then show that matching via acoustic-landmark-based fingerprinting is an effective, scalable, and efficient alternative to correlation. In addition, we release Matlab code to fully recreate our experiments1 . 2. Data The experiments were conducted on data recorded during a poster session held as part of a regional technical meeting at Columbia on January 25th, 2014. Approximately 40 people 1 http://labrosa.ee.columbia.edu/projects/ coherence/ Ref: 100_1198 Targ: 20140125 134129 0.06 −79.8 0.04 t_targ − t_ref / sec −80 0.02 −80.2 0 −80.4 −0.02 −80.6 −0.04 −0.06 −80.8 500 Figure 1: Screenshot from video of the recording session. Individuals carrying recorders are wearing red hats, circled in the image. were having discussions and viewing posters hung on the walls of a room approximately 8 m × 16 m. Six of the attendees carried recording devices (four iPhones, one iPod nano with an external mic, and one Zoom H1 recorder) and made simultaneous recordings for about 30 minutes. (All attendees had been warned in advance that the recording would be performed, and those carrying recorders wore red hats to remind other attendees that they were being recorded2 ). A video camera captured an overhead view during the same period; the red hats made it possible to manually verify the approximate locations of each recorder-carrying participant, except for a small corner of the room which was out of view. Fig. 1 shows an example frame from the video, with the red hats circled. When all six recordings were assembled after the session, they were manually aligned by reference to the time stamps imposed by the recording devices (mostly reliable to within a few seconds), checked against the video, then verified and corrected for clock drift as described in the next section. This resulted in 29 minutes with complete coverage from 5 of 6 recorders with the sixth also present for the first 19 minutes. Synchronization was better than 0.1 s across all recordings. 2.1. Alignment with skewview We have developed a program called skewview [15] to visualize and correct small time shift and clock skew differences between contemporaneous, similar recordings. It can be used, for instance, to perform after-the-fact synchronization between a lapel mic recording and the soundtrack of a simultaneous video shot from the back of a classroom. skewview takes the two waveforms, and first makes one long cross correlation of the entire tracks (possibly decimated to reduce the computational burden) to estimate the approximate global time shift. Then the signal to be aligned is cut into frames of typically between 1 and 30 s, with typically half-window hops, and is cross-correlated with longer segments cut from the same time centers in the reference recording, such that full-length correlations are calculated over a range of shifts. The cross-correlation is calculated by DFT with appropriate zero-padding. Each point is divided by the harmonic mean of the norms of contents the two windows, making it a true correlation coefficient with magnitude smaller than 1 and with no intrinsic tapering towards the edges. The cross-correlations are plotted as a grayscale image, with rela2 Despite this consent, we regretfully consider this raw audio data too sensitive to release openly. 1000 1500 t_ref / sec 2000 Figure 2: Short-time normalized cross-correlation between camera microphone and one of the participant recordings. Correlations are calculated over 30 s windows every 15 s; the peak in each frame is highlighted with a red dot. The participant recording started around 80 s later than the camera, and exhibited a drift of approx. 0.2 s over the 2400 s recording (83 ppm). tive lag on the vertical axis versus window center time on the horizontal axis, as shown in fig. 2, which compares the camera audio to one of the participant mic signals (before alignment) using 30 s windows every 15 s. The largest absolute value in each vertical slice is highlighted with a dot if it is larger than 0.2× the largest correlation seen in any frame. The system attempts to find an outlier-insensitive best-fit line segment to these points, where the vertical offset corresponds to fixed time skew and the slope indicates clock drift; optionally, skewview will trim and resample the input file according to the best-fit line to write a new version of the input file correctly aligned to the reference. We find recordings from different devices can show clock drift of several hundred parts per million, which would lead to desynchronization of up to a second or more in an hourlong recording were it not corrected. By cross-correlating relatively long windows, any underlying common signal components will eventually come to dominate the noisy, chance correlations of unrelated sounds. We find that resampling both signals to as low as 1 kHz reduces the computational burden without impacting the ability to identify the correlation. When clock drift is large (say 0.1% or more) it can be detrimental to use very long windows since the nonnegligible drift within the span of the window itself (e.g. 10 ms across a 10 s window) can significantly blur, and thus lower, the cross-correlation peak. In this case, several stages of estimated alignment and resampling, starting with shorter windows to minimize within-window drift, but progressing to longer windows as the effective sampling clocks are brought more closely in sync, can be effective. As another example of its robustness to uncorrelated added signals, we have successfully used skewview to align individual tracks from a multitrack studio recording (such as an a capella version) to the full mix [16]. 3. Approach 3.1. Cross-correlation The natural way to detect similarities between recordings is via short-time cross-correlation. The closer two microphones are, the greater the correlation between their recorded signals, with the precise relationship of correlation to separation depending cr dl bm cr dl de hp zc cr bm dl de hp zc dl de dl bm cr de hp zc de bm cr dl hp zc de bm cr dl hp zc hp bm cr dl de zc hp bm cr dl de zc bm de hp zc bm dl cr de hp zc bm cr hp zc zc bm cr dl de hp 0.3 zc 1 2 3 4 5 6 7 0 correlation 8 9 10 11 12 13 14 15 16 17 18 19 20 21 22 23 24 25 26 27 28 29 30 time / min bm cr dl de hp 5 0 counts 1 2 3 4 5 6 7 8 9 10 11 12 13 14 15 16 17 18 19 20 21 22 23 24 25 26 27 28 29 30 time / min Figure 3: Comparison between the two methods for identifying proximity. Left pane: Local cross-correlations between all six recordings. Each subpane shows the peak normalized cross-correlation between 10 s windows for each subject against the five remaining recordings. Subject HP ceased recording at 19 min, the remaining signals extend to 29 or 30 min. Right pane: Proximity estimation by shared acoustic landmark detection; gray density shows the number of matching acoustic landmark hashes within a 5 sec window. The vertical stripe corresponds to fig 1. on the spatial coherence of the ambient soundfield, which itself depends on the diversity of the incident sound sources, and the dominant wavelengths in the sources. We used the short-time cross-correlation functions of skewview to identify periods of correlation between the different subjects. Since we were interested in the time-variation of correlation, we used shorter 10 s windows (instead of the 30 s windows used for alignment) evaluated every 2 s, then took the largest normalized cross-correlation value within a ±1 s maximum lag as an indication of the proximity between the subjects. (Since the recordings were already synchronized, it was not necessary to search a wider range of lags, although in principle this could have been included). The data were downsampled to 2 kHz before calculating correlations; this reduces the computational expense substantially, but in our experience does not hurt the ability to identify correlations in noise, which are perhaps mainly carried by energetic low-frequency voicing. 3.2. Fingerprinting As an alternative to cross-correlation similarity, and following [14], we used fingerprinting based on acoustic landmarks as an alternative approach to gauging proximity. The algorithm we used was initially developed for identifying music being played in potentially noisy environments and captured via a mobile phone [2], and as such is highly tolerant of added noise and distortion, as well as being able to scale efficiently to millions of reference recordings. The method works by identifying the most prominent energy peaks in a time-frequency analysis of a particular recording, then encoding the pattern of these prominent peaks into quantized “hashes” describing the time and frequency relationship of pairs of nearby landmarks. Since noise and acoustic channel distortion will most likely only add extra peaks and/or change the amplitude of the existing peaks, but not shift or delete them, a sufficient density of recorded hashes will, in principle, include some hashes that match the original, undistorted background music being played. To identify background music, query audio is converted to the quantized hashes; a database is accessed to identify all reference tracks that include any of these hashes, then the candidate matches with the most hashes in common are evaluated to see if they include those hashes at consistent relative timings. Depending on the number of distinct, quantized hashes (typically 1M or more, corresponding to 8 or 9 bit quantization of frequencies and 6 or 7 bit quantization of time differences), and the precision required in confirming relative timings (typically 30-100 ms over a 5-20 s query), the probability of chance matches can be made very low, and matches can be made even if only a tiny fraction of reference hashes – 1 % or fewer – are correctly identified in the query. True match probability increases with the length of the query, and also with the density of landmarks recorded and the number of hashes derived from each landmark. However, the computational expense of matching and reference database storage requirements also increase with hash density, so the precise parameters chosen will depend on the application. We used audfprint, an open-source implementation of landmark-based fingerprinting for these experiments [17]. We adjusted the default parameters to better suit our application consisting of a relatively small number of long-duration recordings, and we used a density of around 30 hashes per second (four times the default) to improve performance in noise. Our six recordings, comprising 10,030 s (167 min) of total audio, resulted in 371,294 hashes. Note that fingerprint matching is not entirely symmetric: the query audio is generally analyzed with a larger hash density than the reference items, in the interests of limiting the size of the reference database. When detecting a match between two tracks, fingerprinting simply counts the number (or average rate) of common hashes with consistent relative timing between two tracks. To recover the finer time variation of proximity between two individuals desired in this application, we take all the common, temporally-consistent hash matches between two tracks, and represent them as a single function counting the number of common hashes occurring within each 23 ms time step. This count is then smoothed over a 5 s window to get a moving average of the number of matching hashes per second. This is a more smoothly-varying score that can be directly compared to the local correlation scores. 4. Experiments Figure 3 presents the results of proximity estimation based on cross-correlation (left pane) and fingerprinting (right). In both FP DET curve for XC threshold 0.15 Miss probability (in %) 40 20 10 5 2 1 0.5 0.2 0.1 0.1 0.5 2 5 10 20 40 False Alarm probability (in %) Figure 4: Detection Error Tradeoff (DET) curve for predicting the thresholded cross-correlation peaks from the smoothed matching hash counts. The curve flattens out at Pmiss = 6.6% because of stretches where zero matching hashes were recorded despite supra-threshold correlation. cases, we performed a full set of 6 × 6 pairwise comparisons between the signals, thus comparing each pair twice, once as a source and once as a destination. The plots show, for each subject, the respective proximity features (normalized correlation, or matching hash count within a 5 s window) against all subjects on a 2 s resolution. Self-comparisons are excluded for clarity. 4.1. Evaluation We informally evaluated the accuracy of the cross-correlation proximity detection by reviewing the video for the major proximity events indicated by the correlation. For instance, fig. 1 shows the video at time 5:38; in fig. 3, we see at this time high correlations between BM and DE (the red-hatted figures in the foreground), another high-mutual-correlation clique between DL, HP, and ZC (the three figures in the back of the picture), and CR largely uncorrelated to the other signals (the isolated hat in the picture). Shorter, less pronounced events, such as the correlation peak between CR and DE around minute 10 are also backed up by brief exchanges visible in the video. Based on these observations, we thresholded the crosscorrelation scores at 0.15 to get a binary ground-truth (of high normalized cross-correlation) against which to evaluate the smoothed fingerprint matching hash counts. Excluding the selfto-self comparison rows this gives an overall prior of 4.8% of two frames counting as “near”. We then sweep a threshold on the hash counts to obtain a Detection Error Tradeoff (DET) curve [18] shown in fig. 4, illustrating the trade-off between false alarms (frames judged close according to cross correlation but not detected by fingerprinting) and misses (frames judged close by fingerprinting but not by cross correlation). (We used the software from [19]). Although the equal-error rate of 13.4% is quite high, in practice the more important operating point is to have low false alarms (since in most applications we expect many more time frames without proximity), and to tolerate the relatively high miss probability this dictates (since a given “proximal encounter” may persist for several minutes, giving multiple opportunities for detection). In terms of performance, on this dataset, and using these implementations which were not optimized for the task, computation time is roughly comparable: To process the entire 10,030 s dataset (including 6 × 6 pairwise comparisons) takes 427 s using cross correlation, with the core comparison between a pair of 30 min tracks taking around 11 s. The total computation time of the fingerprint technique is 317 s, which breaks down as 12 s per track to analyze and build the hash database, then 41 s per query to find the matches against all the reference items. (Most of this time is consumed calculating landmarks at small frame offsets, to mitigate framing effects). For 6 users, then, the computational advantage of the fingerprint technique is not outstanding. However, for cross-correlation, the computational expense of exhaustive comparison among a group of recordings grows as the square of the amount of data being considered; if we had been comparing recordings from all 40 participants in the poster session instead of just 6, our computation would have taken 44× longer. With fingerprinting, the retrieval of matching tracks is, to first-order, a constant-time operation for each query, since the technique was developed to efficiently match samples against a very large number of reference items. Thus, running 40 users would take only ≈ 7× longer (depending on the impact of the more densely-populated fingerprint index). Moreover, our cross-correlation relies on reasonable synchronization between the tracks being compared (to avoid having to search over a wide range of lags), whereas the fingerprinting intrinsically searches over all possible time skews between recordings and will automatically identify the correct relative timing between two tracks – useful if the recordings have not been collected with reference to a common clock. 5. Discussion and Conclusions Our main purpose has been to show that a fingerprint-based approach is able to detect changing proximity between individuals based on similarities identified within their “personal audio” recordings. We further sought to show that fingerprinting is able detect these similarities as effectively as cross-correlation, but with far better potential for scaling and computational efficiency. Another consideration in this scenario is privacy: continuous recording of audio may be unacceptable to certain users or in certain situations. The fingerprint technique, however, does not rely on full audio, but only on the drastically reduced representation of the individual landmark hashes. Even for high-density landmark recording, the reference database for the entire 167 min of audio was only 4.1 MB on disk, compared to 80 MB for the full audio – even when stored as 64 Mbps compressed MP3 files. Because only a sparse sampling of the spectral peaks are retained in fingerprinting, it is impossible to recover intelligible audio from this representation, giving this approach distinct advantages from a privacy standpoint. Given the ease with which ambient personal audio can be collected and processed by the powerful smartphones that are now so common, we believe it is inevitable that this data stream will be increasingly exploited for a variety of applications. We have shown that tracking episodes of personal proximity in a real-world, high-noise environment is quite feasible from this data, leading to interesting and rich maps of interpersonal interactions. We have further shown that an existing landmarkbased audio fingerprinting approach is successful at approximating the proximity results obtained by more expensive crosscorrelation. We foresee many such applications for a privacypreserving continuous summary of daily acoustic environment provided by the acoustic landmark stream. 6. Acknowledgment Thanks to Brian McFee, Colin Raffel, Dawen Liang, and Hélène Papadopoulos for being subjects, and to all the participants in the SANE 2013 and NEMISIG 2014 poster sessions for co-operating in collecting the data. 7. References [1] D. P. W. Ellis and K. Lee, “Accessing minimal-impact personal audio archives,” IEEE MultiMedia, vol. 13, no. 4, pp. 30–38, Oct-Dec 2006. [Online]. Available: http://www.ee.columbia.edu/ ∼dpwe/pubs/EllisL06-persaud.pdf [2] A. Wang, “The Shazam music recognition service,” Comm. ACM, vol. 49, no. 8, pp. 44–48, Aug. 2006. [3] C. Cotton and D. P. W. Ellis, “Audio fingerprinting to identify multiple videos of an event,” in Proc. IEEE ICASSP, Dallas, 2010, pp. 2386–2389. [4] M. Lamming and M. Flynn, “Forget-me-not: Intimate computing in support of human memory,” in Proc. FRIEND21, 1994 Int. Symp. on Next Generation Human Interface, Meguro Gajoen, Japan, 1994. [5] R. Want, A. Hopper, V. Falcao, and J. Gibbons, “The active badge location system,” ACM Transactions on Information Systems (TOIS), vol. 10, no. 1, pp. 91–102, 1992. [6] L. E. Holmquist, J. Falk, and J. Wigström, “Supporting group collaboration with interpersonal awareness devices,” Personal Technologies, vol. 3, no. 1-2, pp. 13–21, 1999. [7] B. Thiel, K. Kloch, and P. Lukowicz, “Sound-based proximity detection with mobile phones,” in Proceedings of the Third International Workshop on Sensing Applications on Mobile Phones. ACM, 2012, p. 4. [8] N. Eagle and A. Pentland, “Reality mining: sensing complex social systems,” Personal and ubiquitous computing, vol. 10, no. 4, pp. 255–268, 2006. [9] H. Lu, W. Pan, N. D. Lane, T. Choudhury, and A. T. Campbell, “Soundsense: scalable sound sensing for people-centric applications on mobile phones,” in Proceedings of the 7th international conference on Mobile systems, applications, and services. ACM, 2009, pp. 165–178. [10] S. P. Tarzia, P. A. Dinda, R. P. Dick, and G. Memik, “Indoor localization without infrastructure using the acoustic background spectrum,” in Proceedings of the 9th international conference on Mobile systems, applications, and services. ACM, 2011, pp. 155–168. [11] T. Nakakura, S. Yasuyuki, and T. Nishida, “Neary: Conversational field detection based on situated sound similarity,” IEICE transactions on information and systems, vol. 94, no. 6, pp. 1164–1172, 2011. [12] H. Satoh, M. Suzuki, Y. Tashiro, and H. Morikawa, “Ambient sound-based proximity detection with smartphones,” in Proceedings of the 11th ACM Conference on Embedded Networked Sensor Systems (SenSys 2013), vol. 58, Rome, Italy, Nov 2013. [Online]. Available: http://www.mlab.t.u-tokyo.ac.jp/attachment/ file/293/SenSys201311-satoh.pdf [13] L. Kennedy and M. Naaman, “Less talk, more rock: automated organization of community-contributed collections of concert videos,” in Proceedings of the 18th international conference on World wide web. ACM, 2009, pp. 311–320. [14] M. Wirz, D. Roggen, and G. Troster, “A wearable, ambient soundbased approach for infrastructureless fuzzy proximity estimation,” in Wearable Computers (ISWC), 2010 International Symposium on. IEEE, 2010, pp. 1–4. [15] D. Ellis, “Skewview - tool to visualize timing skew between files,” web resource, Mar 2011. [Online]. Available: http: //labrosa.ee.columbia.edu/projects/skewview/ [16] C. Raffel and D. Ellis, “Estimating timing and channel distortion across related signals,” in Proc. ICASSP, Florence, May 2014, p. (to appear). [17] D. Ellis, “Audfprint - audio fingerprint database creation + query,” web resource, Dec 2011. [Online]. Available: http://labrosa.ee.columbia.edu/matlab/audfprint/ [18] A. Martin, G. Doddington, T. Kamm, M. Ordowski, and M. Przybocki, “The det curve in assessment of detection task performance,” DTIC Document, Tech. Rep., 1997. [19] NIST Multimodal Information Group, “Detware version 2.1,” web resource, Aug 2000. [Online]. Available: http://www.itl.nist. gov/iad/mig/tools/
