Institutional Research Report Headcount by Student Level
advertisement
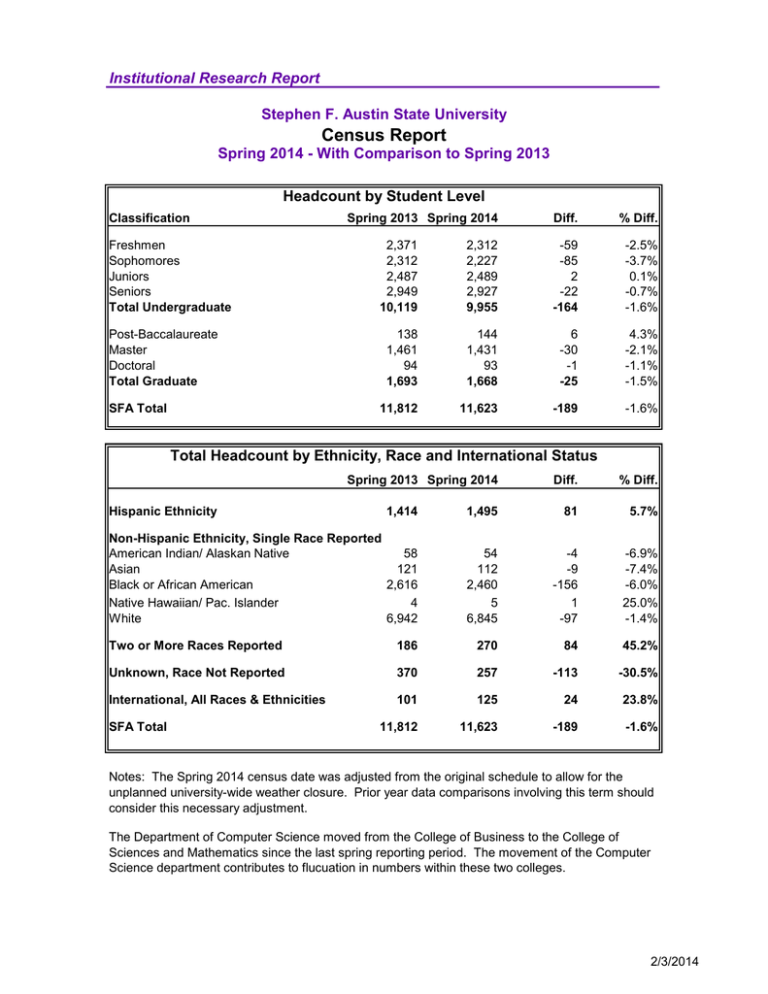
Institutional Research Report Stephen F. Austin State University Census Report Spring 2014 - With Comparison to Spring 2013 Headcount by Student Level Classification Freshmen Sophomores Juniors Seniors Total Undergraduate Post-Baccalaureate Master Doctoral Total Graduate SFA Total Spring 2013 Spring 2014 Diff. % Diff. 2,371 2,312 2,487 2,949 10,119 2,312 2,227 2,489 2,927 9,955 -59 -85 2 -22 -164 -2.5% -3.7% 0.1% -0.7% -1.6% 138 1,461 94 1,693 144 1,431 93 1,668 6 -30 -1 -25 4.3% -2.1% -1.1% -1.5% 11,812 11,623 -189 -1.6% Total Headcount by Ethnicity, Race and International Status Spring 2013 Spring 2014 Hispanic Ethnicity Diff. % Diff. 1,414 1,495 81 5.7% Non-Hispanic Ethnicity, Single Race Reported American Indian/ Alaskan Native 58 Asian 121 Black or African American 2,616 Native Hawaiian/ Pac. Islander 4 White 6,942 54 112 2,460 5 6,845 -4 -9 -156 1 -97 -6.9% -7.4% -6.0% 25.0% -1.4% Two or More Races Reported 186 270 84 45.2% Unknown, Race Not Reported 370 257 -113 -30.5% International, All Races & Ethnicities 101 125 24 23.8% 11,812 11,623 -189 -1.6% SFA Total Notes: The Spring 2014 census date was adjusted from the original schedule to allow for the unplanned university-wide weather closure. Prior year data comparisons involving this term should consider this necessary adjustment. The Department of Computer Science moved from the College of Business to the College of Sciences and Mathematics since the last spring reporting period. The movement of the Computer Science department contributes to flucuation in numbers within these two colleges. 2/3/2014 Institutional Research Report Stephen F. Austin State University Headcount Enrollment Census Report Spring 2014 - With Comparison to Spring 2013 Total Headcount by College Spring 2013 Spring 2014 College Business Education Fine Arts Forestry & Agriculture Liberal and Applied Arts Sciences & Math Total 1,639 4,014 799 657 2,730 1,973 11,812 1,506 4,029 773 656 2,595 2,064 11,623 Diff. % Diff. -133 15 -26 -1 -135 91 -189 -8.1% 0.4% -3.3% -0.2% -4.9% 4.6% -1.6% Undergraduate Headcount by College Spring 2013 Spring 2014 College Business Education Fine Arts Forestry & Agriculture Liberal and Applied Arts Sciences & Math Total 1,547 3,076 722 518 2,416 1,840 10,119 1,387 3,054 697 536 2,342 1,939 9,955 Diff. % Diff. -160 -22 -25 18 -74 99 -164 -10.3% -0.7% -3.5% 3.5% -3.1% 5.4% -1.6% Diff. % Diff. 27 37 -1 -19 -61 -8 -25 29.3% 3.9% -1.3% -13.7% -19.4% -6.0% -1.5% Graduate Headcount by College College Business Education Fine Arts Forestry & Agriculture Liberal and Applied Arts Sciences & Math Total Spring 2013 Spring 2014 92 938 77 139 314 133 1,693 119 975 76 120 253 125 1,668 Notes: The Spring 2014 census date was adjusted from the original schedule to allow for the unplanned university-wide weather closure. Prior year data comparisons involving this term should consider this necessary adjustment. The Department of Computer Science moved from the College of Business to the College of Sciences and Mathematics since the last spring reporting period. The movement of the Computer Science department contributes to flucuation in numbers within these two colleges. 2/3/2014
