Measureable performance objectives ANNEXURE 2
advertisement
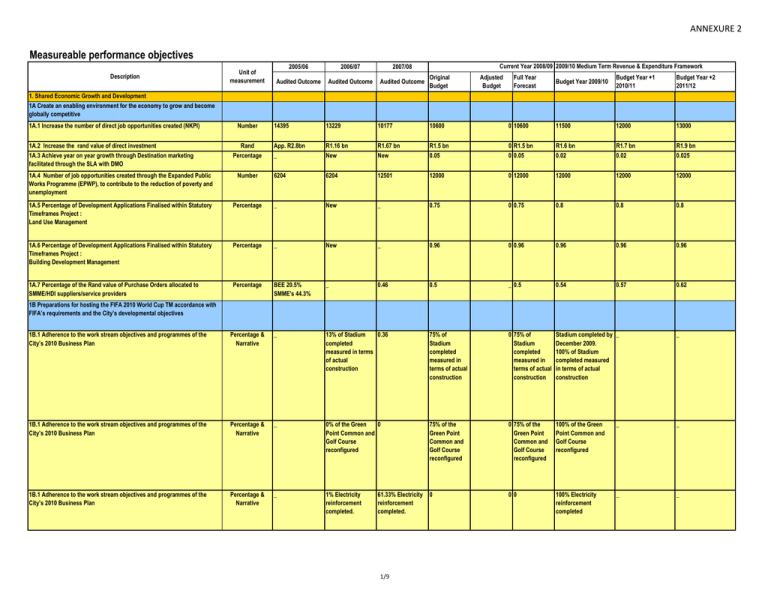
ANNEXURE 2 Measureable performance objectives Description Unit of measurement 2005/06 Audited Outcome 2006/07 Audited Outcome Current Year 2008/09 2009/10 Medium Term Revenue & Expenditure Framework 2007/08 Original Audited Outcome Budget Adjusted Budget Full Year Forecast Budget Year 2009/10 Budget Year +1 2010/11 Budget Year +2 2011/12 11500 12000 13000 1. Shared Economic Growth and Development 1A Create an enabling environment for the economy to grow and become globally competitive 1A.1 Increase the number of direct job opportunities created (NKPI) 1A.2 Increase the rand value of direct investment 1A.3 Achieve year on year growth through Destination marketing facilitated through the SLA with DMO Number Rand Percentage 14395 13229 10177 10600 0 10600 App. R2.8bn R1.16 bn R1.67 bn R1.5 bn 0 R1.5 bn R1.6 bn R1.7 bn R1.9 bn _ New New 0.05 0 0.05 0.02 0.02 0.025 6204 6204 12501 12000 0 12000 12000 12000 12000 1A.4 Number of job opportunities created through the Expanded Public Works Programme (EPWP), to contribute to the reduction of poverty and unemployment Number 1A.5 Percentage of Development Applications Finalised within Statutory Timeframes Project : Land Use Management Percentage _ New _ 0.75 0 0.75 0.8 0.8 0.8 1A.6 Percentage of Development Applications Finalised within Statutory Timeframes Project : Building Development Management Percentage _ New _ 0.96 0 0.96 0.96 0.96 0.96 1A.7 Percentage of the Rand value of Purchase Orders allocated to SMME/HDI suppliers/service providers Percentage BEE 20.5% SMME's 44.3% _ 0.46 0.5 _ 0.5 0.54 0.57 0.62 1B Preparations for hosting the FIFA 2010 World Cup TM accordance with FIFA’s requirements and the City’s developmental objectives 1B.1 Adherence to the work stream objectives and programmes of the City’s 2010 Business Plan Percentage & Narrative _ 0.36 13% of Stadium completed measured in terms of actual construction 75% of Stadium completed measured in terms of actual construction 0 75% of Stadium completed measured in terms of actual construction Stadium completed by _ December 2009. 100% of Stadium completed measured in terms of actual construction _ 1B.1 Adherence to the work stream objectives and programmes of the City’s 2010 Business Plan Percentage & Narrative _ 0 0% of the Green Point Common and Golf Course reconfigured 75% of the Green Point Common and Golf Course reconfigured 0 75% of the Green Point Common and Golf Course reconfigured 100% of the Green Point Common and Golf Course reconfigured _ _ 1B.1 Adherence to the work stream objectives and programmes of the City’s 2010 Business Plan Percentage & Narrative _ 1% Electricity reinforcement completed. 0 00 100% Electricity reinforcement completed _ _ 61.33% Electricity reinforcement completed. 1/9 ANNEXURE 2 Measureable performance objectives Description Unit of measurement 2005/06 Audited Outcome 2006/07 Audited Outcome Current Year 2008/09 2009/10 Medium Term Revenue & Expenditure Framework 2007/08 Original Audited Outcome Budget Adjusted Budget Full Year Forecast Budget Year 2009/10 Budget Year +1 2010/11 Budget Year +2 2011/12 Detailed 2010 Transport Operational Plan 75% complete 0 Detailed 2010 Transport Operational Plan 75% complete Detailed 2010 _ Transport Operational Plan 100% complete _ 0% of the _ reconfiguration of the Green Point Common completed. Awaiting approval on the Site Development Plan from the Provincial Minister. _ 0_ _ _ _ _ New Conceptualise model for 2010 footprint i.e. Fan Parks, Viewing Sites and Training Venues, in terms of affordability and resources Implement and prepare detailed operating plans for 2010 footprint: 75% complete 0 Implement and prepare detailed operating plans for 2010 footprint: 75% complete Implement and prepare detailed operating plans for 2010 footprint: 100% complete _ _ Percentage & Narrative _ Percentage _ compliance with all other work streams in the 2010 Business Plan: 0% Percentage compliance with all other work streams in the 2010 Business Plan: 75% 0 Percentage compliance with all other work streams in the 2010 Business Plan: 75% _ Percentage compliance with all other work streams in the 2010 Business Plan: 100% _ Narrative _ RFP for Operator advertised. Naming Rights awarded and Operator appointed 0 Naming Rights _ awarded and Operator appointed 1B.1 Adherence to the work stream objectives and programmes of the City’s 2010 Business Plan Percentage & Narrative _ Appointment of consultant in procurement phase to do detailed 2010 Transport Operational Plan. 1B.1 Adherence to the work stream objectives and programmes of the City’s 2010 Business Plan Percentage & Narrative _ 1B.1 Adherence to the work stream objectives and programmes of the City’s 2010 Business Plan Percentage & Narrative 1B.1 Adherence to the work stream objectives and programmes of the City’s 2010 Business Plan 1B.2 Completion of process to award Naming Rights for Stadium and appointment of long term Operator to manage Stadium 20% completed Operator not appointed Strategic focus area 2: Sustainable Urban Infrastructure and Services 2A Universal access to basic services 2/9 _ _ ANNEXURE 2 Measureable performance objectives Description Unit of measurement 2005/06 Audited Outcome 2006/07 Audited Outcome Current Year 2008/09 2009/10 Medium Term Revenue & Expenditure Framework 2007/08 Original Audited Outcome Budget Adjusted Budget Full Year Forecast Budget Year 2009/10 Budget Year +1 2010/11 Budget Year +2 2011/12 2A.1 Percentage of households with access to basic levels of sanitation (NKPI) Percentage 0.954 0.979 0.971 0.975 0 0.975 99.1% N1 99.4% N1 99.7% N1 2A.2 Percentage of households with access to basic levels of water (NKPI) Percentage 1 1 1 1 01 100% N1 100% N1 100% N1 2A.3 Percentage of households with access to basic levels of Electricity (NKPI) Percentage 0.889 0.9112 0.925 0.9083 0 0.9083 90.46% N1 91.28% N1 92.11% N1 2A .4 Percentage of households with access to basic levels of solid waste removal (NKPI) Percentage 0.99 0.99 0.99 0.99 0 0.99 99% N1 99% N1 99% N1 2B Conservation of natural resources 2B.1 Percentage reduction in unconstrained water demand Percentage 0.277 0.255 0.26 0.275 0 0.275 0.27 0.27 0.27 2B.2 Percentage compliance with 4 critical DWAF effluent standards (Ecoli count, Ammonia content, Oxygen demanding substances, Total suspended solids) Percentage 0.739 0.812 0.81 0.83 0 0.83 0.87 0.91 0.95 2B.3 Percentage of recreational waters sampling points (i.e. bathing beaches, vleis, lagoons, etc) comply with applicable Department of Water Affairs standards Percentage _ 0.87 0.65 0.78 0 0.78 0.8 0.82 0.85 2B.4 Percentage cleanliness of the City (Metropolitan Cleanliness/ Photographic index) Percentage _ 0.61 0.77 0.7 0 0.7 0.7 0.7 0.7 2B.5 Percentage of airspace saved in relation to the volume of waste disposed Percentage _ 0.1473 0.1655 0.15 0 0.15 0.155 0.16 0.165 2C Effective management of City’s Infrastructure and Resources 3/9 ANNEXURE 2 Measureable performance objectives Description Unit of measurement 2005/06 Audited Outcome 2006/07 Audited Outcome Current Year 2008/09 2009/10 Medium Term Revenue & Expenditure Framework 2007/08 Original Audited Outcome Budget Adjusted Budget Full Year Forecast Budget Year 2009/10 Budget Year +1 2010/11 Budget Year +2 2011/12 Transport To be provided Roads & Stormwater To be provided Electricity: Medium Voltage • Phase 4 Water & Sanitation Wastewater Treatment Plants • Phases 1,2 & 3 Solid Waste Landfill Sites • Phases 1,2 & 3 Transport To be provided Roads & Stormwater To be provided Electricity: Low Voltage • Phases 2,3 & 4 Water & Sanitation Sewer Network • Phases 1,2 & 3 Solid Waste Transfer Stations & Drop-off facilities • Phases 1,2 & 3 Fleet • Phase 4 Narrative _ New Initial target is no longer relevant as it was set in June 07 with the information that was available at that stage. After December 07, a more realistic project plan was compiled that has informed the amended targets. Australian consultant has been involv 75% completion of established Asset Management register for Major Infrastructure Departments 0 75% completion of established Asset Management register for Major Infrastructure Departments Transport To be provided Roads & Stormwater To be provided Electricity: Medium Voltage • Phases 2 & 3 Water & Sanitation Sewer Pump Stations • Phases 1, 2 & 3 Solid Waste Fleet • Phases 1, 2 & 3 Percentage _ New _ Reduction of 10% 0 Reduction of 10% Maintain reduction of Maintain reduction of Maintain reduction of 10% 10% 10% 4A.1 Reduction of average commuter travel time on selected transport corridors (home to work – peak period- public transport) Minutes & Percentage _ 45 Minutes Travel time along 38 Minutes the N2 BMT lane reduced by 20 min for Public Transport users and 5 min for other modes. Metrowide travel time not available. _ 38 Minutes 10% reduction in travel time along Phase 1A of the Atlantis corridor 10% reduction in travel time along Phase 1B of the Atlantis corridor 10% reduction in travel time along the full Atlantis corridor 4A.2 Increase cumulative kilometres of critical routes with dedicated public transport lanes on selected transport corridors Kilometres _ 45km's 53km's 0 12km on baseline 15km on baseline 20km on baseline 35km on baseline 2C.1 Phased completion of an integrated Infrastructure Asset Management Programme in respect of Transport, Roads & Stormwater, Electricity, Water, Sanitation and Solid Waste Management Phase 1: Completed Asset Register Phase 2: Completed Evaluation Phase Strategic focus area 3: Energy Efficiency for a Sustainable City 3A The Development, Adoption and Implementation of a comprehensive response to the City’s energy and climate change challenges 3A.1 Reduction in energy consumption in the Cape Metropolitan Area below projected unconstrained energy consumption Strategic focus area 4: Public Transport Systems 4A Improve public transport system and services 4/9 12km on baseline ANNEXURE 2 Measureable performance objectives Description Unit of measurement 4A.3 Progressive evolution towards a single point of authority for transport Narrative 2005/06 Audited Outcome 2006/07 Audited Outcome Current Year 2008/09 2009/10 Medium Term Revenue & Expenditure Framework 2007/08 Original Audited Outcome Budget Intergovernmental Inaugural meeting Transport Founding authority fully transport of Metropolitan agreement and business plan was agreement drafted Transport Planning operational Advisory Council approved by held. Section 78 (3) Council in June of the Municipal 2006 Systems Act now in progress. National Land Transport Bill 2008 currently debated in parliament Adjusted Budget Full Year Forecast Budget Year 2009/10 Budget Year +1 2010/11 Budget Year +2 2011/12 0 Transport authority fully operational ‘Municipal Entity to provide Public Transport Services’ established ‘Municipal Entity to provide Public Transport Services’ operational ‘Municipal Entity to provide Public Transport Services” operational Strategic focus area 5: Integrated Human Settlements 5A Improve and develop Integrated Human Settlements 5A.1 Percentage completion of the Spatial Development Framework (SDF) and District Spatial Development Plans (SDP’s) Phases 1-5 completed to prepare City SDF and District Spatial Development Plans (SDP'S) Percentage _ 15% Approvals to proceed with preparation of plans in place. City’s intention to prepare the plans advertised to the public. First internal drafts of plans prepared. 30% Draft of SDF underway. 1st round of public meetings on preparation of SDF completed. PEPCO endorsement of vision, principles, issues and strategic goals obtained. Draft of SDF underway. Draft 1 of district spatial development plans reviewed internall 90% City SDF and District SDP’s completed and submitted to Provincial Government of the Western Cape (PGWC ) for approval. 0 90% City SDF and District SDP’s completed and submitted to Provincial Government of the Western Cape (PGWC ) for approval. 3rd round of City SDF & 8 District advertisement of City SDP/EMF’s approved SDF and District by PGWC SDP’s for comment completed( subject to timing of feedback from PGWC) Implementation of the City SDF & 8 District SDP/ EMF’s 5995 7519 (Was 7182 @30.6.2007 6439 9900 0 9900 10200 11000 5B Delivery of housing opportunities 5B.1 Number of housing opportunities provided per year including Community Residential Units developed. (CRU) Number 5/9 10200 ANNEXURE 2 Measureable performance objectives Description Unit of measurement 2005/06 Audited Outcome 2006/07 Audited Outcome Current Year 2008/09 2009/10 Medium Term Revenue & Expenditure Framework 2007/08 Original Audited Outcome Budget Adjusted Budget Full Year Forecast Budget Year 2009/10 Budget Year +1 2010/11 Budget Year +2 2011/12 5B.2 Implementation of Informal Settlement Upgrade programme (Upgrading of Informal Settlements Programme (UISP) and Emergency Housing Programme (EHP). Number 100% Framework developed Framework plan approved (including essential services) 100% Compliance *60 informal settlements were serviced 100% compliance with plan specifications 0 100% compliance with plan specifications 1000 Incrementally Serviced Erven. 1200 Incrementally Serviced Erven. 1400 Incrementally Serviced Erven 5B.3 Development of an urbanisation and informal settlement improvement strategy Narrative _ Not applicable Not applicable New 0 New Approved draft To be determined urbanisation strategy based on approved strategy To be determined based on approved strategy Percentage _ 0.64 0.82 0.9 0 0.9 0.93 1 1 6A.1 Percentage adherence to key objectives in the City Security Plan (Previous Indicator - % adherence to the Citys' Law Enforcement Plan) Percentage _ _ 3 _ 0_ Achieving ≥3 on 5 point Likert scale on community survey regarding positive perception on decrease in prevalence of antisocial behaviour Achieving ≥3 on 5 point Likert scale on community survey regarding positive perception on decrease in prevalence of antisocial behaviour Achieving ≥3 on 5 point Likert scale on community survey regarding positive perception on decrease in prevalence of antisocial behaviour 6A.1 Percentage adherence to key objectives in the City Security Plan (Previous Indicator - % adherence to the Citys' Law Enforcement Plan) Percentage _ _ _ _ 0_ 12% reduction in the 12% reduction in the 12% reduction in the incidence of all crime incidence of all crime incidence of all crime categories categories categories 6A.1 Percentage adherence to key objectives in the City Security Plan (Previous Indicator - % adherence to the Citys' Law Enforcement Plan) Percentage _ 0 New 0 00 10% increase in arrests in drug related crimes (Possession & Dealing) 10% increase in arrests in drug related crimes (Possession & Dealing) 10% increase in arrests in drug related crimes (Possession & Dealing) 6A.1 Percentage adherence to key objectives in the City Security Plan (Previous Indicator - % adherence to the Citys' Law Enforcement Plan) Percentage _ 0 5 months 0 00 Reduce turnaround time between applications and appointments for learner/driver testing to 5 months Maintain 5 months turnaround time between applications and appointments for learner/driver testing Maintain 5 months turnaround time between applications and appointments for learner/driver testing 5C Provision of equitable community facilities and services across the city. 5C 1 Percentage of community facilities meeting set standards. Strategic focus area 6: Safety and Security 6A Foster a safe and secure environment 6/9 ANNEXURE 2 Measureable performance objectives Description 6A.2 Percentage adherence to the implementation of Disaster Plans according to legislative requirements Unit of measurement Percentage 2005/06 2006/07 Current Year 2008/09 2009/10 Medium Term Revenue & Expenditure Framework 2007/08 Original Audited Outcome Budget Audited Outcome Audited Outcome 100% - Council approved new plan in june 2006. Plans updated: Mitigation Flood Plan, Koeberg Nuclear Plan, Major Aircraft Disaster Plan Disaster Management Plan as per statutory requirements completed and approved 1. Disaster Management Plan developed and approved. 2. 100% compliance with quarterly targets 100% compliance with plan Adjusted Budget Full Year Forecast Budget Year 2009/10 Budget Year +1 2010/11 Budget Year +2 2011/12 0 100% compliance with plan 1. Disaster Management Plan developed and approved. 2. 100% reviewed with quarterly targets 1. Disaster Management Plan developed and approved. 2. 100% reviewed with quarterly targets 1. Disaster Management Plan developed and approved. 2. 100% reviewed with quarterly targets Strategic focus area 7: Health, social and community development 7A Facilitating the development of a healthy and socially inclusive society 7A.1 Number of Child Care facilities upgraded/provided in partnership with governmental and NGOs to promote holistic childhood development. Number _ New 0 3 03 3 3 3 7A.2 Number of targeted socio-economic development support programmes Number _ New _ 4 04 4 4 4 7A.3 Number of street people placed in rehabilitation and reintegration programmes. Number _ 280 449 300 0 300 300 300 300 7A.4 Number of strategic sporting partnerships and events created maintained and expanded on. Number _ 10 19 19 0 19 19 22 24 7A.5 Number of days when air pollution exceeds WHO guidelines Number _ 132 128 140 0 140 137 135 133 7A.6 Reduction of the infant mortality rate (Number infant deaths per 1000 live births) Number _ 21.4 20.28 20 0 20 19.5 19.2 19 7A.7 Slow the rate of increase of TB per 100 000 of Cape Town Population Number _ 831 876 1040 0 1040 1090 1120 1140 Percentage _ 0.152 0.159 0.19 0 0.19 0.193 0.196 0.198 Weeks _ 7.2 6.5 8 08 7 7 6 8A.2 Retention of skills as measured by staff turnover Percentage _ _ _ _ 0_ 5% to 8% overall turnover 5% to 8% overall turnover 5% to 8% overall turnover 8A.2 Retention of skills as measured by staff turnover Percentage _ _ _ _ 0_ 8% to 12% within skilled categories 8% to 12% within skilled categories 8% to 12% within skilled categories 8A.3 Staff availability as measured by % absenteeism Percentage _ New New New 0 New ≤ 4% average for the period 1 July 2009 to 30 June 2010 ≤ 4% average for the period 1 July 2010 to 30 June 2011 ≤ 4% average for the period 1 July 2011 to 30 June 2012 7A.8 Slow the rate of increase of the City’s ante-natal HIV prevalence Strategic focus area 8: Good governance and regulatory reform 8A Ensuring enhanced service delivery with efficient institutional arrangements 8A.1 Improved average turnaround time of tender procurement processes in accordance with procurement plan 7/9 ANNEXURE 2 Measureable performance objectives Description Unit of measurement 2005/06 Audited Outcome 2006/07 Audited Outcome Current Year 2008/09 2009/10 Medium Term Revenue & Expenditure Framework 2007/08 Original Audited Outcome Budget Adjusted Budget Full Year Forecast Budget Year 2009/10 Budget Year +1 2010/11 Budget Year +2 2011/12 8A.4 Percentage budget spent on implementation of WSP (NKPI) Percentage _ 0 0 0.9 0 0.9 0.9 0.9 0.9 8A.5 Percentage improvement in the positive employee climate as per annual Culture Climate Survey Percentage _ New 0.25 0.28 0 0.28 0.31 0.34 0.37 8A.6 Percentage of capital projects meeting original planned milestones Percentage _ New New 0.8 0 0.8 0.85 0.9 0.9 8A.7 Percentage improvement in the time taken to close notifications in terms of the Corporate Works Management process Percentage _ New New 100% of C3 notification process implemented including geocoding and correspondenc e functionality 0 100% of C3 notification process implemented including geocoding and correspondenc e functionality 12% reduction in time taken to close notifications (measured against the baseline) 10% reduction in time taken to close notifications (measured against the baseline) 10% reduction in time taken to close notifications (measured against the baseline) Percentage 0.2127 0.2107 0.2177 0.197 _ 0.197 0.225 0.22 0.22 8 B Management of key financial and governance areas such as income control, cash flow, indigent support, alternative income opportunities, asset and risk management 8B.1 Net Debtors to Annual Income [Ratio of outstanding service debtors to revenue actually received for services (NKPI)] Ratio 4.31:1 4.51:1 3.21:1 4.50:1 _ 4.50:1 2.5:1 2.4:1 2.2:1 8B.3 Percentage of City’s Capital budget spent (NKPI) Percentage 0.815 0.77 0.78 0.95 _ 0.95 0.95 0.98 0.98 8B.4 Percentage of City’s operating budget spent Percentage 0.9961 0.92 90% (100% completion after completion of the financial statements as confirmed by the CFO) 0.98 _ 0.98 0.95 0.95 0.95 8B.2 Debt coverage by own billed revenue (NKPI) Ratio 2.6:1 3.01:1 4.67:1 3.1:1 _ 3.1:1 3.2:1 3.3:1 3.5:1 8B.6 Revenue collected as a percentage of billed amount Percentage 0.952 0.993 0.9471 0.96 _ 0.96 0.95 0.95 0.95 8B.7 Percentage reduction in the number of recurring findings emanating from Internal Audit Percentage _ New 0.4857 0.6 _ 0.6 0.7 0.8 0.9 Unqualified audit received from AG Unqualified audit received from AG Unqualified audit received from AG Unqualified audit received from AG _ Unqualified Unqualified audit audit received received from AG from AG Unqualified audit received from AG Unqualified audit received from AG _ A1+ (short term) AA- (long term) Maintained Aa2-za P-1 (short term) from Moody's. Aa2.za (long Prime -1 (Short term) term) _ P-1 (short term) P-1 (short term) Aa2.za (long Aa2.za (long term) term) P-1 (short term) Aa2.za (long term) P-1 (short term) Aa2.za (long term) 8B.5 Ratio of cost coverage maintained 8B.8 Unqualified Audit from Auditor General 8B.9 Maintain City’s credit rating Narrative Credit rating 8/9 ANNEXURE 2 Measureable performance objectives Description 8B.10 Percentage annual asset verification process completed Unit of measurement 2005/06 Audited Outcome 2006/07 Audited Outcome Current Year 2008/09 2009/10 Medium Term Revenue & Expenditure Framework 2007/08 Original Audited Outcome Budget Adjusted Budget Full Year Forecast Budget Year 2009/10 Budget Year +1 2010/11 Budget Year +2 2011/12 Percentage _ _ _ 100% completed by 31 May _ 100% completed by 31 May 100% verification of 100% verification of 100% verification of the assets completed the assets completed the assets completed by 30 June by 30 June by 30 June Scale _ _ 2.4 2.5 _ 2.5 2.6 8C Establish effective community engagement channels 8B.10 Percentage annual asset verification process completed 9/9 2.7 2.8
