Conserved noncoding sequences
COMMENT
Outlook
Conserved noncoding sequences are
reliable guides to regulatory elements
A ‘working draft’ of the human genome sequence is now available. Comparisons with the sequences of mouse
and other species will be a powerful approach to identifying functional segments of the noncoding regions,
such as gene regulatory elements. However, the choice of a species for most effective comparison differs
among various loci.
n June 2000, the International Human Genome
Sequencing Consortium announced a ‘working draft’ of
the human genome. In this assembly, approximately 87%
of the genome has been sequenced, with about 21% in finished form and 66% in draft form, exceeding the goals
announced in 1998 (Ref. 1). (Updated information is
available at http://www.ncbi.nlm.nih.gov/genome/seq) At
the same time, Celera Corporation announced their first
assembly of the human genome sequence. These are heady
days for the sequencers. Even though a finished, highquality sequence of the human genome will not be available for another year or more, the working draft sequence
has so much information, sufficiently close to complete,
that it marks a major milestone in modern biology.
Moreover, the analysis of this information could lead to a
revolution in the life sciences, as biologists begin to adapt
to the limitations – and power – of having a finite (albeit
large) number of gene products to consider2. Thus a pressing issue is how to proceed with functional analysis of
this massive amount of sequence – currently greater than
three billion base pairs!
Software for finding coding exons has reached a high
degree of sophistication and accuracy3, so most of the
3–5% of the human genome coding for protein will be
identified in short order. Even after masking out the
roughly 40% of the genome with interspersed repeats4,
analysis of the remaining half of the genome, the unique,
noncoding portion, is a daunting task.
A powerful approach to finding functional segments in
noncoding genomic DNA is comparison with other
sequences. This approach has a rich history, dating at least
to the discovery of bacteriophage promoter and operator
sequences5. Comparison of long genomic DNA sequences
between two species reveals conserved noncoding sequences
(CNSs) (See Box 1 for definitions), and at the HBB (encoding beta-globin) and BTK (encoding Bruton’s tyrosine
kinase) loci, these have been demonstrated to be involved in
the regulation of gene expression (reviewed in Ref. 6).
Several recent papers compare human and mouse DNA
sequences over long genomic segments (e.g. Refs 7–9), and
in most cases they find that human–mouse sequence comparisons were useful both for accurately identifying exons
and for finding candidate regulatory regions. The many
CNSs observed should provide an impetus for a large number of experiments. However, it is not always clear what
function to test for, or even which gene is a likely target of a
proposed regulatory element. For instance, the distal major
regulator of HBA (encoding alpha-globin) is found in the
intron of a ubiquitously expressed gene of unknown
function, located 40 kb away from the nearest globin gene10.
I
0168-9525/00/$ – see front matter © 2000 Elsevier Science Ltd. All rights reserved. PII: S0168-9525(00)02081-3
A CNS affects expression of genes encoding
interleukins
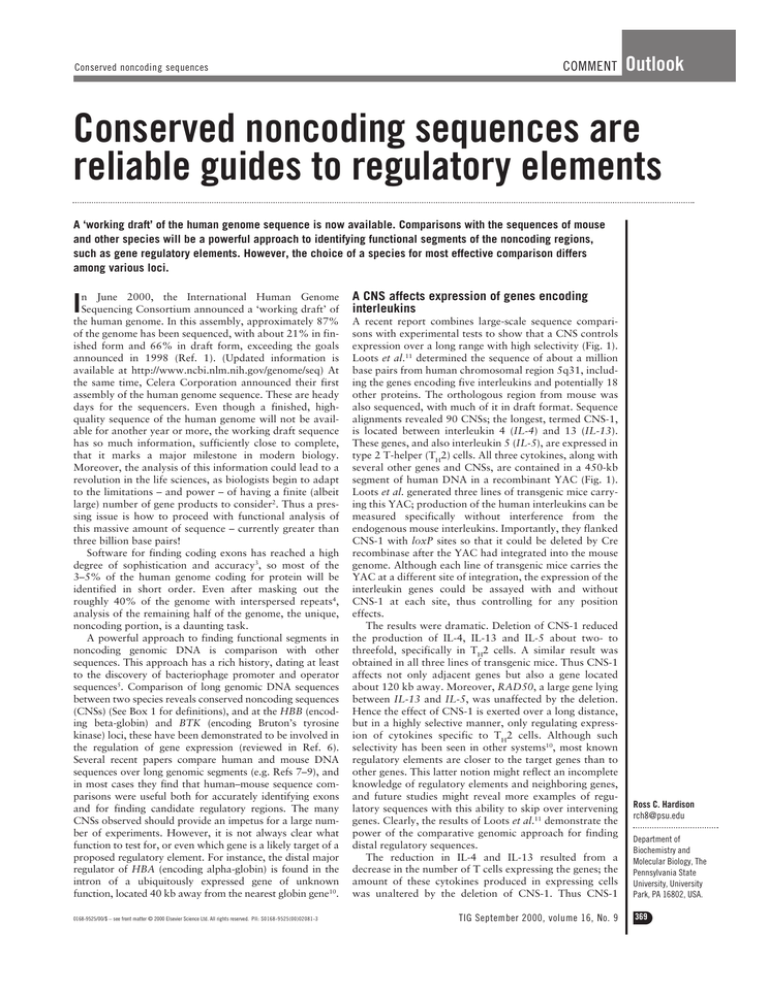
A recent report combines large-scale sequence comparisons with experimental tests to show that a CNS controls
expression over a long range with high selectivity (Fig. 1).
Loots et al.11 determined the sequence of about a million
base pairs from human chromosomal region 5q31, including the genes encoding five interleukins and potentially 18
other proteins. The orthologous region from mouse was
also sequenced, with much of it in draft format. Sequence
alignments revealed 90 CNSs; the longest, termed CNS-1,
is located between interleukin 4 (IL-4) and 13 (IL-13).
These genes, and also interleukin 5 (IL-5), are expressed in
type 2 T-helper (TH2) cells. All three cytokines, along with
several other genes and CNSs, are contained in a 450-kb
segment of human DNA in a recombinant YAC (Fig. 1).
Loots et al. generated three lines of transgenic mice carrying this YAC; production of the human interleukins can be
measured specifically without interference from the
endogenous mouse interleukins. Importantly, they flanked
CNS-1 with loxP sites so that it could be deleted by Cre
recombinase after the YAC had integrated into the mouse
genome. Although each line of transgenic mice carries the
YAC at a different site of integration, the expression of the
interleukin genes could be assayed with and without
CNS-1 at each site, thus controlling for any position
effects.
The results were dramatic. Deletion of CNS-1 reduced
the production of IL-4, IL-13 and IL-5 about two- to
threefold, specifically in TH2 cells. A similar result was
obtained in all three lines of transgenic mice. Thus CNS-1
affects not only adjacent genes but also a gene located
about 120 kb away. Moreover, RAD50, a large gene lying
between IL-13 and IL-5, was unaffected by the deletion.
Hence the effect of CNS-1 is exerted over a long distance,
but in a highly selective manner, only regulating expression of cytokines specific to TH2 cells. Although such
selectivity has been seen in other systems10, most known
regulatory elements are closer to the target genes than to
other genes. This latter notion might reflect an incomplete
knowledge of regulatory elements and neighboring genes,
and future studies might reveal more examples of regulatory sequences with this ability to skip over intervening
genes. Clearly, the results of Loots et al.11 demonstrate the
power of the comparative genomic approach for finding
distal regulatory sequences.
The reduction in IL-4 and IL-13 resulted from a
decrease in the number of T cells expressing the genes; the
amount of these cytokines produced in expressing cells
was unaltered by the deletion of CNS-1. Thus CNS-1
TIG September 2000, volume 16, No. 9
Ross C. Hardison
rch8@psu.edu
Department of
Biochemistry and
Molecular Biology, The
Pennsylvania State
University, University
Park, PA 16802, USA.
369
Outlook
COMMENT
Conserved noncoding sequences
FIGURE 1. Deletion of a conserved noncoding sequence selectively reduces expression of cytokine genes
over a long distance
25 kb
CNS-2 CNS-1
Human
5q31
YAC A94G6
CNS-14
CNS-15 CNS-9 CNS-8
lox lox
KIF3A
IL-4 IL-13
RAD50
IL-5
IRF1
Hs.70932
OCTN2
OCTN1
Integrate into random sites in mouse genome
Delete CNS-1 via Cre recombinase
∆
Result:
IL-4 IL-13
RAD50
Decrease
expression
No effect
IL-5
Decrease
expression
trends in Genetics
Genes from human chromosomal position 5q31 located on YAC A94G6 are shown as boxes; those above the line are transcribed 59 to 39 to the right, those below the
line are transcribed to the left. Genes encoding interleukins are colored blue; other genes are arbitrary colors. Conserved, noncoding sequences are shown as arrows.
Sites (loxP ) for directing deletion by the Cre recombinase are green boxes.
affects the probability that this chromosomal region will
be transcriptionally active in a given TH2 cell, but once the
region is activated, CNS-1 is not needed for an appropriate level of expression. It is likely that an epigenetic
process is affected, such as changes in chromatin structure,
DNA methylation, or localization in the interphase
nucleus. Explaining how such processes can be targeted to
specific genes and not others over 120 kb is a major challenge. Models involving looping, tracking and linking
have been proposed for the action of other distal regulators, such as the HBB locus control region, but experimental tests have yet to be devised that clearly distinguish
between them12.
Different comparison species are needed to find
functional CNSs at various loci
If one can extrapolate from the density of CNSs at 5q31, a
total of 270 000 CNSs in the human genome might be predicted. Full exploration of these CNSs would require an
enormous number of transgenic mouse experiments,
doubtless exceeding any conceivable budget for such an
enterprise. Indeed, high-throughput assays, such as the
transgenic frog assay for vertebrate transcriptional
enhancers13, are being developed to allow rapid testing of
the myriad candidate regulatory sequences. In contemplating how the results at 5q31 should impact work at other
loci, two major issues come to mind. Are all these CNSs
likely to be functional? And are the regulatory sites likely
to be found within the CNSs? The most satisfying answers
will come from experimental tests, but other information,
such as additional sequence comparisons, is needed to
direct experimentalists to the most critical regions.
To reduce the number of CNSs to test, one could compare sequences of species separated by a wider phylogenetic
370
TIG September 2000, volume 16, No. 9
distance, as it is reasonable to assume that noncoding
sequences that have survived selection for a longer period
of time might play more important roles in regulation. One
might expect that simply using a more demanding definition of conservation would work as well. However, Loots
et al.11 already adopted a stringent definition of conservation, requiring an ungapped alignment of at least 100 bp
and at least 70% identity. The CNSs are obvious on a percent identity plot, such as shown in Fig. 2a. Note that
CNS-1 is longer and is more similar between mouse and
human than are the coding exons for the flanking interleukin genes. Looking in more distantly related species was
not successful in this case, as the CNSs at 5q31 were not
clearly detectable in chicken or Fugu, at least by a PCR
assay11. Of course, determining the sequences of orthologous loci in chicken and fish and aligning those sequences
with the mammalian loci would be a more sensitive (and
expensive) way to address this issue.
This result contrasts with earlier work on enhancers of
HOX genes, which are conserved between mammals and
the teleost fish Fugu rubripes14. The ability to detect CNSs
over this wider phylogenetic distance seems to result from
the very slow rates of divergence of the HOX gene clusters. Kim et al.15 found striking examples of CNSs
throughout the HOXA cluster when the human sequence
was compared to that of the primitive horn shark,
Heterodontus francisci. Figure 2b shows examples of
these in the region containing HOXA10, HOXA9 and
HOXA7. The human HOXA sequence is also compared
with the mouse and Fugu sequences. The human and
mouse sequences align throughout this segment. The
HOX gene clusters, like the locus encoding T-cell receptor
genes16, is under intense selective pressure, and selection is
exerted throughout the region. Thus the criteria used to
COMMENT
Conserved noncoding sequences
Outlook
FIGURE 2. Percent identity plots comparing human and other sequences at three loci
(a)
IL-4
CNS-1
21
4
IL-13
32
1
100%
Mus IL-4,
IL-13
75%
0k
2k
4k
6k
8k
10k
HOXA10
(b)
1
12k
14k
16k
HOXA9
2
1
50%
20k
18k
HOXA7
2
1
2
100%
75%
Mus Hoxa
50%
100%
Heterodontus
HoxM/A
75%
Fugu HoxM/A
75%
50%
100%
0k
2k
(c)
4k
6k
8k
10k
12k
14k
16k
Beta-globin locus control region
HS4
HS3
HS2
50%
20k
18k
HBE1
HS1
12
100%
75%
Mus Hbb
0k
2k
4k
6k
8k
10k
12k
14k
16k
18k
50%
20k
trends in Genetics
The percent identity plot (pip) is a compact display of the results of aligning the human sequence with the designated second sequence. Each plot shows the positions in the human sequence and the
percent identity of each aligning segment between gaps in the alignment. Along the top line of each plot, exons are indicated as black boxes and untranslated regions as light gray boxes. Within each
plot, coding exons are underlayed with blue, and untranslated regions and introns are underlayed with yellow. (a) Comparison of part of the human 5q31 sequence (GenBank accession number
AC004039.1) with the orthologous mouse sequence (AC005742.1). The conserved noncoding sequence (CNS) region of the pip is underlayed with red, and noncoding regions that align but do not fit
the criteria in Loots et al.11 (an ungapped alignment of at least 100 bp and at least 70% identity) are green. (b) Comparison of part of the human HOXA cluster (AC004080.1) with the orthologous
sequence in mouse (AC015583.6) in the top panel, Heterodontus francisci (horn shark, AF224262.1) in the middle panel, and Fugu rubripes (teleost fish, FRU92573) in the bottom panel. Within the
pips, CNSs found in comparison with Heterodontus are underlayed with red. (c) Comparison of part of the human HBB locus (U01317.1) with the mouse Hbb locus (X14061.1). Colors in the pip are
orange for DNase hypersensitive sites (also indicated as open boxes along the top of the plot), red for a match that fits the criteria of Loots et al.11 for a CNS, and green for other noncoding, aligning
regions, many of which have been implicated in regulation. The pips were generated by PipMaker (http://bio.cse.psu.edu)21.
identify CNSs at 5q31 finds many more CNSs in a
human–mouse comparison of HOX genes than can be
reasonably studied. However, extending the phylogenetic
distance covered to that between mammals and fish (shark
or pufferfish) reveals noncoding sequences that are under
stronger selection, and hence likely to be involved in more
critical functions. Of course, the noncoding sequences
conserved between human and mouse, but not between
human and fish, might indeed be functional in mammals,
but an experimentalist would want to test the most highly
conserved regions first.
On the other hand, criteria that work well for finding a
CNS at one locus might be too stringent at another locus.
Figure 2c shows a pip of the human and mouse sequences
in the beta-globin locus control region and the promoter
for the epsilon-globin gene, HBE1. Sequences at the
DNase hypersensitive sites, and some sequences between
them, are conserved in mammals and are needed for
function of the locus control region (reviewed in Ref. 17).
However, only one segment (located in HS2) fulfils the
criteria used to define CNSs at 5q31. Thus a less stringent
definition, or use of species phylogenetically closer to
human, is appropriate at this locus. For other loci, a nonmammalian, warm-blooded vertebrate might be most
informative. For example, Gottgens et al.13 found that
some noncoding sequences of the SCL/TAL1 gene are
strongly conserved between human and chicken, and they
showed that one such CNS is a neural enhancer.
Thus the choice of appropriate species to compare in an
effort to find CNSs that are the best candidates for function will depend on the locus being investigated. It is clear
from many comparisons6,8,9 that mouse and human
sequences will be highly informative at many, and perhaps
most, loci. This is good news, as the genomic sequence of
both will be determined in the near future. Indeed, even
shotgun sample sequencing of mouse is likely to reveal
TIG September 2000, volume 16, No. 9
371
Outlook
COMMENT
Box 1. Glossary
Coding sequences
DNA sequences that code for proteins or many RNAs
(rRNA, snRNA, tRNA).
Conserved noncoding sequences (CNSs)
In general, these are noncoding sequences that match in
alignments of sequences between two species. One can
define criteria that may be more likely to identify
sequences under selective pressure, such as requiring a
length of at least 100 bp and a percent identity of at least
70%1.
Contig
A contiguous, or uninterrupted, DNA sequence generated
from a set of overlapping sequences of shorter length.
Finished genomic DNA sequence
A contiguous sequence with ,1 error per 10 000 bases.
Noncoding sequences
In general, these are DNA sequences that do not code for
proteins or stable RNAs, such as the sequences between
genes. However, the noncoding regions of protein-coding
genes include the untranslated regions (even though
these are present in mature mRNA) and introns (even
though these are transcribed).
Percent identity plot (pip)
A compact display of the results of aligning two
sequences, where the positions (in the first sequence) and
percent identity of gap-free aligning segments are plotted,
along with icons for features in the first sequence.
Working draft of the human genome
A set of DNA sequences representing coverage of about
90% of the human genome. The remaining 10% cannot be
sequenced with current technology; much of it is highly
repetitive DNA, such as that from centromeres. In the
current public sequencing effort, mapped clones are
initially ‘shotgun’ sequenced in an automated and efficient
process. These shotgun data are assembled into a
‘draft sequence’ that covers most of the region of
interest but still contains gaps and ambiguities. The
second phase of sequencing fills the gaps and resolves
ambiguities, producing a finished sequence. The working
draft of the human genome is a combination of finished
and draft sequence. The draft sequence has an average
contig length of 15 kb, and about one error per 5000
bases.
Reference
1 Loots, G.G. et al. (2000) Identification of a coordinate regulator of
interleukins 4, 13, and 5 by cross-species sequence comparisons. Science 288,
136–140
much information about coding and noncoding
sequences18. As these genomes are completed, however,
the choice of additional species to sequence will be critical19. We hope that we will soon have a better idea of
which portions of the mammalian genome are changing as
slowly as the HOX clusters or more rapidly than HBB.
Software is available for finding conserved
sequences
Finding conserved sequences requires both genomic DNA
sequences and good software for aligning them. Both of
372
TIG September 2000, volume 16, No. 9
Conserved noncoding sequences
these are now freely available to any investigator, so anyone
can incorporate these methods into their research. The
human genome sequences for many loci are either now or
soon will be in the public domain, and the sequencing of
mouse is under way20. Several alignment programs are
available, many of them from public servers. The PipMaker
server (http://bio.cse.psu.edu/) specializes in the alignment
of extremely long genomic DNA sequences (up to two
million base pairs in each sequence) and returns the results
in compact, flexible and easily understood formats21. An
additional server for comparative genomic sequence
analysis, called VISTA (http://www-gsd.lbl.gov/vista/), is
now available22. Use of such servers, in conjunction with the
expanding array of publicly available resources, should
make genomic analysis accessible to all interested investigators. The successes reported by Loots et al.11 and others
emphasize the benefit of incorporating rigorous analysis
of genomic DNA sequences, including interspecies comparisons, at an early stage of projects in functional genomics.
Acknowledgements
I thank W. Miller, D. Schübeler, M. Bulger and the
reviewers for helpful comments. Work from this laboratory was supported by PHS grants DK27635, LM05110
and LM05773.
References
1 Collins, F.S. et al. (1998) New goals for the US Human Genome Project:
1998–2003. Science 282, 682–689
2 Lander, E.S. (1996) The new genomics: global views of biology. Science 274,
536–539
3 Claverie, J-M. (1997) Computational methods for the identification of genes in
vertebrate genomic sequences. Hum. Mol. Genet. 6, 1735–1744
4 Smit, A.F. (1996) The origin of interspersed repeats in the human genome. Curr.
Opin. Genet. Dev. 6, 743–748
5 Pribnow, D. (1975) Nucleotide sequence of an RNA polymerase binding site at
an early T7 promoter. Proc. Natl. Acad. Sci. U. S. A. 72, 784–788
6 Hardison, R. et al. (1997) Long human–mouse sequence alignments reveal
novel regulatory elements: a reason to sequence the mouse genome. Genome
Res. 7, 959–966
7 Ansari-Lari, M.A. et al. (1998) Comparative sequence analysis of a gene-rich
cluster at human chromosome 12p13 and its syntenic region in mouse
chromosome 6. Genome Res. 8, 29–40
8 Ellsworth, R.E. et al. (2000) Comparative genomic sequence analysis of the
human and mouse cystic fibrosis transmembrane conductance regulator genes.
Proc. Natl. Acad. Sci. U. S. A. 97, 1172–1177
9 Lund, J. et al. (2000) Comparative sequence analysis of 634 kb of the mouse
chromosome 16 region of conserved synteny with the human velocardiofacial
syndrome region on chromosome 22q11.2. Genomics 63, 374–383
10 Vyas, P. et al. (1995) Conservation of position and sequence of a novel, widely
expressed gene containing the major human a-globin regulatory element.
Genomics 29, 679–689
11 Loots, G.G. et al. (2000) Identification of a coordinate regulator of interleukins
4, 13, and 5 by cross-species sequence comparisons. Science 288, 136–140
12 Bulger, M. and Groudine, M. (1999) Looping versus linking: toward a model for
long-distance gene activation. Genes Dev. 13, 2465–2477
13 Gottgens, B. et al. (2000) Analysis of vertebrate SCL loci identifies conserved
enhancers. Nat. Biotechnol. 18, 181–186
14 Aparicio, S. et al. (1995) Detecting conserved regulatory elements with the
model genome of the Japanese puffer fish, Fugu rubripes. Proc. Natl. Acad. Sci.
U. S. A. 92, 1684–1688
15 Kim, C.B. et al. (2000) Hox cluster genomics in the horn shark, Heterodontus
francisci. Proc. Natl. Acad. Sci. U. S. A. 97, 1655–1660
16 Koop, B.F. and Hood, L. (1994) Striking sequence similarity over almost 100
kilobases of human and mouse T-cell receptor DNA. Nat. Genet. 7, 48–53
17 Hardison, R. et al. (1997) Locus control regions of mammalian b-globin gene
clusters: combining phylogenetic analyses and experimental results to gain
functional insights. Gene 205, 73–94
18 Bouck, J.B. et al. (2000) Shotgun sample sequence comparisons between
mouse and human genomes. Nat. Genet. 25, 31–33
19 Miller, W. (2000) So many genomes, so little time. Nat. Biotechnol. 18, 148–149
20 Battey, J. et al. (1999) An action plan for mouse genomics. Nat. Genet. 21,
73–75
21 Schwartz, S. et al. (2000) PipMaker–a web server for aligning two genomic DNA
sequences. Genome Res. 10, 577–586
22 Dubchak, I. et al. Active conservation of noncoding sequences revealed by 3way species comparisons. Genome Res. (in press)


