SHOCK AND VIBRATION RESPONSE SPECTRA COURSE Unit 1A. Natural Frequency Calculation Email:
advertisement
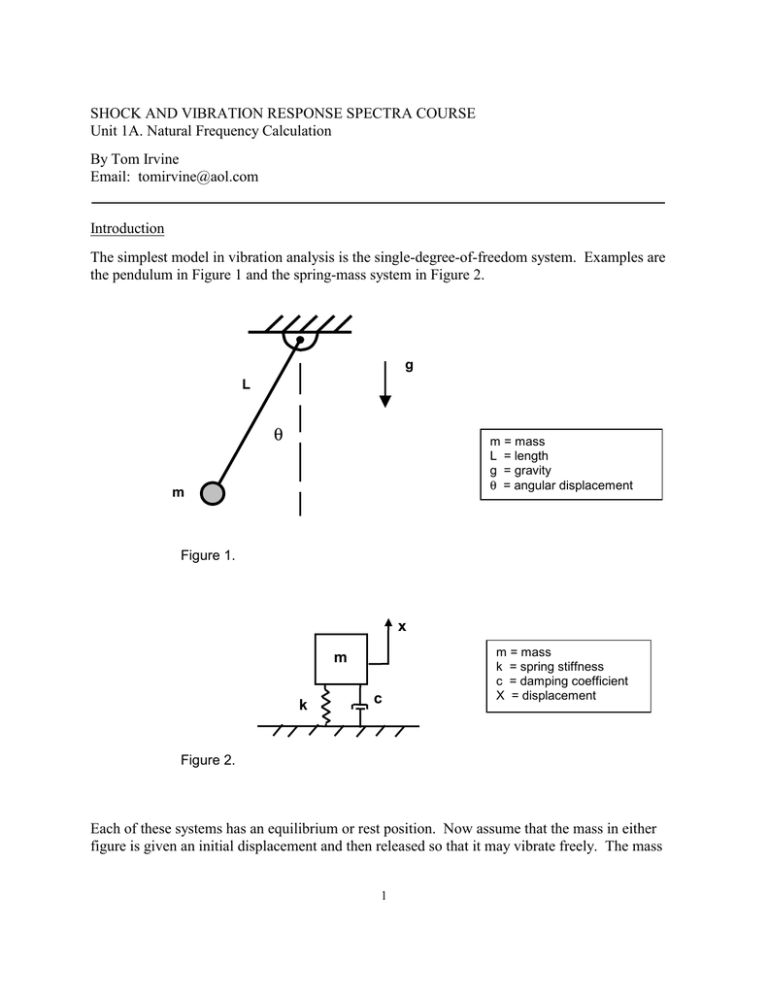
SHOCK AND VIBRATION RESPONSE SPECTRA COURSE Unit 1A. Natural Frequency Calculation By Tom Irvine Email: tomirvine@aol.com Introduction The simplest model in vibration analysis is the single-degree-of-freedom system. Examples are the pendulum in Figure 1 and the spring-mass system in Figure 2. g L θ m = mass L = length g = gravity θ = angular displacement m Figure 1. x m k c m = mass k = spring stiffness c = damping coefficient X = displacement Figure 2. Each of these systems has an equilibrium or rest position. Now assume that the mass in either figure is given an initial displacement and then released so that it may vibrate freely. The mass 1 will oscillate at a single frequency which is called the natural frequency. This is know as "simple harmonic motion." Eventually, the oscillation will decay. The mass will return to its rest position. The decay is referred to as "damping." Some Simple Physics Kinetic energy is the energy of motion. It is proportional to the velocity squared. The mass achieves its greatest kinetic energy as it passes through its rest position. Potential energy is stored energy. The pendulum's potential energy is proportional to the hieght that it is raised above its rest position with respect to the gravity field. A spring's potential energy is proporational to the distance squared that it is stretched or compressed from its rest position. The pendulum achieves its greatest potential energy when it reaches its maximum angular displacement. The spring reaches achieves its greatest potential energy when the mass reaches its maximum displacement in either the positive or negative direction. The energy relationships are summarized in Table 1. Table 1. Energy Relationships for an Oscillating Displacement Kinetic Energy Zero Maximum Maximum Zero Mass Potential Energy Zero Maximum The conservation of energy requries that maximum kinetic energy must equal the maximum potential energy, assuming no energy dissipation. Lord Rayleigh derived mathematical equations which showed that the conservation of energy can only be fulfilled at a system's natural frequency. Natural Frequency Formulas The natural frequency ω n for a pendulum is ωn = g L (1) The natural frequency for a spring-mass system is ωn = k m (2) 2 The ω n natural frequency has dimensions of radians/time. The typical unit is radians/second. Note that ωn = 2 π f n fn = (3) ωn 2π (4) The variable f n is the natural frequency in cycles/time. The typical unit is cycles/second, which is called Hertz. The unit Hertz is abbreviated as Hz. Note that the period T is T= 1 fn (5) The period is the time required for one complete cycle of oscillation. Benefits of Natural Frequency All physical objects have one or more natural frequencies. As an example, a piano wire must be tuned to a particular frequency to match a particular musical note. The "A above middle C" note is defined as having a natural frequency of 440 Hz. The wire thus vibrates 440 times per second. This vibration produces acoustic pressure waves at the same frequency. Music is one example where natural frequencies are thus necessary and desirable. Natural frequencies are beneficial in other areas. Pendulum motion has been used to measure time. In addition, a child enjoys the pendulum motion of swing. Astronauts aboard a space shuttle orbiting the Earth experience "apparent weightlessness." They simply cannot use a bathroom-type scale device to measure their weight. Instead, the astronauts sit on chair that is mounted to a frame via springs, as shown in Figure 3. The chair oscillates at a natural frequency that is dependent on the astronaut's mass. 3 Figure 3. Spring-loaded Chair Device for Measuring Astronaut's Mass The astronaut can then calculate his or her mass from the natural frequency using equation (2). The equivalent Earth weight can then be calculated from the mass. Drawbacks of Natural Frequency The excitation of a natural frequency may cause failure or even fatalities in certain situations. There are four methods by which a structure's natural frequency may be excited. They are summarized in Table 2. Table 2. Methods of Excitation Method Applied Pressure or Force Base Excitation Self-excited Instability Initial Displacement or Velocity Example 1. Hammer strikes mass 2. Airflow or wind excites structure such as an aircraft wing 3. Rotating mass imbalance in motor 4. Pressure oscillation in rocket motor 1. Vehicle traveling down washboard road 2. Earthquake Airfoil or Bridge Flutter Plucking guitar string Resonance occurs when the applied force or base excitation frequency coincides with the system's natural frequency. During resonant vibration, the response displacement may increase until the structure experiences buckling, yielding, fatigue, or some other failure mechanism. 4 The Tacoma Narrows Bridge failure is often cited as an example of resonant vibration. In reality, it was a case of self-excited vibration, as explained in Reference 1. The failure of the Cypress Viaduct in the 1989 Loma Prieta Earthquake is example of failure due to resonant excitation. A collapsed deck is shown in Figure 4. Resonant vibration caused 50 of the 124 spans of the Viaduct to collapse. The reinforced concrete frames of those spans were mounted on weak soil. As a result, the natural frequency of those spans coincided with the frequency of the earthquake ground motion. The Viaduct structure thus amplified the ground motion. The spans suffered increasing vertical motion. Cracks formed in the support frames. Finally, the upper roadway collapsed, slamming down on the lower road. The remaining spans that were mounted on firm soil withstood the earthquake. Figure 4. Cypress Viaduct Failure There are many additional examples whereby knowledge of structure's natural frequency is critical. 5 Consider a rocket vehicle with a closed-loop guidance system. The autopilot has an internal navigation system that uses accelerometers and gyroscopes to determine the vehicle's attitude and direction. The navigation system then sends commands to actuators that rotate the exhaust nozzle to steer the vehicle during its powered flight. Feedback sensors measure the position of the nozzle. The data is sent back to the navigation computer. Unfortunately, the feedback sensors, accelerometers, and gyroscopes could be affected by the vehicle's vibration. Specifically, instability could result if the vibration frequency coincides with the control frequency. Multi-degree-of-freedom Systems In reality, structures have numerous natural frequencies. The lowest natural frequency is called the "fundamental frequency." The higher natural frequencies may, or may not, occur at integer multiples of the fundamental frequency. The higher natural frequencies are called harmonics if they occur at integer multiples of the fundamental frequency. As an example, the "A above middle C" note has a fundamental frequency of 440 Hz, with harmonics at 880 Hz, 1320 Hz, 1760 Hz, etc. The blend of harmonics gives the music a rich sound. The natural frequencies of a beam or plate, however, do not occur at harmonic frequencies. In many cases, the fundamental frequency is the dominant frequency. Thus, many systems can be modeled as single-degree-of-freedom systems. For example, a cantilever beam has numerous natural frequencies. Striking the free end tends to yield a response dominated by the fundamental frequency. Tall Building A tall building is clearly a multi-degree-of-freedom system. It can be modeled as a singledegree-of-freedom system, however, for preliminary calculations. The 1994 Uniform Building Code (UBC) gives the following empirical formulas for the fundamental frequency fn and period T of a tall building. fn = 1 (6) Ct h 3 / 4 T = Ct h 3 / 4 (7) 6 where h is the height. Ct is an empirical factor given in Table 3. Table 3. Empirical Factor Ct Type Masonry and wood buildings Reinforced concrete moment resisting frames and eccentrically braced frame Steel moment resisting frames English Metric sec Ct ft 3 / 4 0.020 sec Ct meters 3 / 4 0.049 0.030 0.073 0.035 0.0853 Note that the frequency is a bending frequency. The motion is in the lateral direction, parallel to the ground. The mode shape is similar to that of a cantilever beam. 7 Figure 5. Earth's Natural Frequency The Earth experiences seismic vibration. The fundamental natural frequency of the Earth is 309.286 micro Hertz. This is equivalent to a period of 3233.25 seconds, or approximately 54 minutes. Reference: T. Lay and T. Wallace, Modern Global Seismology, Academic Press, New York, 1995. 8 Figure 6. Golden Gate Bridge The Golden Gate Bridge is a steel suspension bridge. The total length is 8980 ft. In addition to traffic loading, the Golden Gate Bridge must withstand the following environments: 1. Earthquakes, primarily originating on the San Andreas and Hayward faults 2. Winds of up to 70 miles per hour 3. Strong ocean currents The Golden Gate Bridge has performed well in all earthquakes to date, including the 1989 Loma Prieta Earthquake. Several phases of seismic retrofitting have been performed since the initial construction. Note that current Caltrans standards require bridges to withstand an equivalent static earthquake force (EQ) of 2.0 G. The natural frequencies of the Golden Gate Bridge are shown in Table 4. 9 Table 4. Golden Gate Bridge Natural Frequencies Mode Type Period of vibration (sec) Natural Frequency (Hz) Transverse Vertical Longitudinal Torsional 18.2 10.9 3.81 4.43 0.055 0.092 0.262 0.226 Circuit Boards Circuit Boards are often modeled as Single-degree-of-freedom systems. The fundamental bending frequencies of sample circuit boards are shown in Table 5. The avionics components are from rocket vehicles. Table 5. Sample Circuit Boards Avionics Component CEP Fundamental Frequency (Hz) 65 PSSL 210 MUX 220 PDU 225 PCM Encoder 395 TVC 580 Average = 328 Hz Std Dev = 203 Hz Range = 65 Hz to 600 Hz 10 Helicopter Ground Resonance f(t) x m m k c Figure 7. A new helicopter design undergoing testing may encounter severe vibration while it is on the ground, preparing for takeoff. As the rotor accelerates to its full operating speed, a structural natural frequency of the helicopter may be excited. This condition is called resonant excitation. 11 Frequency Measurement A sample acceleration time history is shown in Figure 8. 10 CYLCES / 1 SECOND = 10 Hz 2 1 2 3 4 5 6 7 8 9 10 ACCEL (G) 1 0 -1 -2 0 0.1 0.2 0.3 0.4 0.5 0.6 0.7 0.8 0.9 1.0 TIME (SEC) Figure 8. The time history in Figure 8 was generated analytically. Assume that this data represents the free vibration response of a system with no damping. Also assume single-degree-of-freedom behavior, although the data justifies this assumption. 12 The natural frequency can be calculated via a variety of tools. An example is the Fourier transform which will be covered in a later unit. In certain cases, a manual counting of the peaks is more accurate any other method. The example in Figure 8 shows a signal that undergoes 10 cycles in 1 second. The natural frequency is thus 10 Hz. The period of an individual cycle is the reciprocal of the natural frequency, 0.1 seconds in this example. Again, the example in Figure 8 is free vibration. The system could have been subjected to an initial displacement and then left to vibrate freely. Thus, there is no force or base excitation acting upon the system in this example. Otherwise, the simple counting method might be unreliable. Note that a system which is excited at a frequency of 50 Hz will vibrate at 50 Hz regardless of its natural frequency. More sophisticated methods are required to determine the natural frequency when an external excitation is acting upon a system. Homework Assignment Hints for 1 and 2: Hand calculations often produce errors due to unit conversion errors. Use the sdof_fn program available at: http://www.vibrationdata.com/software.htm Please remember to download the DLL files that are given at the top of the web page. 1. A particular circuit board can be modeled as a single-degree-of-freedom system. Its weight is 0.1 pounds. Its stiffness is 400 pounds per inch. Calculate the natural frequency. 2. A 5 pound avionics box is to be mounted on a rocket vehicle bulkhead via rubber bushings. The bulkhead will experience a 240 Hz oscillation in flight due to the motor pressure oscillation. The design goal is to avoid resonant excitation of the avionics box natural frequency. As a precaution, the goal is to achieve a natural frequency of 120 Hz for the avionics box. The avionics box natural frequency would thus be one-half the forcing frequency. What should the bushing stiffness be (pounds per inch) to achieve this natural frequency? 3. A rocket vehicle is carried underneath an aircraft. It experiences an initial displacement because gravity causes it to bow downward while it is attached to the aircraft. It is suddenly released and allowed to vibrate freely as it falls. It continues falling for about 5 seconds prior to its motor ignition, as a safety precaution. An acceleration time history of the drop is given in file: drop.txt. The acceleration time history shows the body-bending natural frequency. Note that the signal is filtered such that the rigid-body acceleration is not included in the data. 13 The file has two columns: time (sec) and accel (G). The data is in ASCII text format. Call this file into Excel or some other graphics program. Make a hardcopy. Estimate the natural frequency by calculating the number of peaks and then dividing by time. The decay effect is not important for this exercise. Try to make a reasonable estimate. In other words, do not agonize about achieving accuracy finer than 0.1 Hz. Important note: the drop.txt file is actual flight data measured via telemetry. The amplitude has been scaled by an undisclosed factor, however. 4. A building is 200 feet high. It is constructed of steel moment resisting frames. Calculate the period and natural frequency. Use equations (6) and (7). 5. A flagpole is made from steel pipe. The height is 180 inches. The pipe O.D. is 3 inches. The wall thickness is 0.25 inches. The boundary conditions are fixed-free. Determine the fundamental lateral frequency. Use program: beam.exe 6. Read References 1 and 2. 7. Optional Assignment. Procure a tuning fork from a music store. Perform the demonstrations described in Reference 2. References 1. T. Irvine, Tacoma Narrows Bridge Failure, Vibrationdata Publications, 1999. 2. T. Irvine, Tuning Fork Sound and Vibration, Vibrationdata Publications, 2000. 14
