APPENDIX C Table of Present Value Factors
22865_16_apx_p517-520.qxd 12/8/06 3:12 PM Page 518
A : 518
APPENDIX C
Table of Present Value Factors
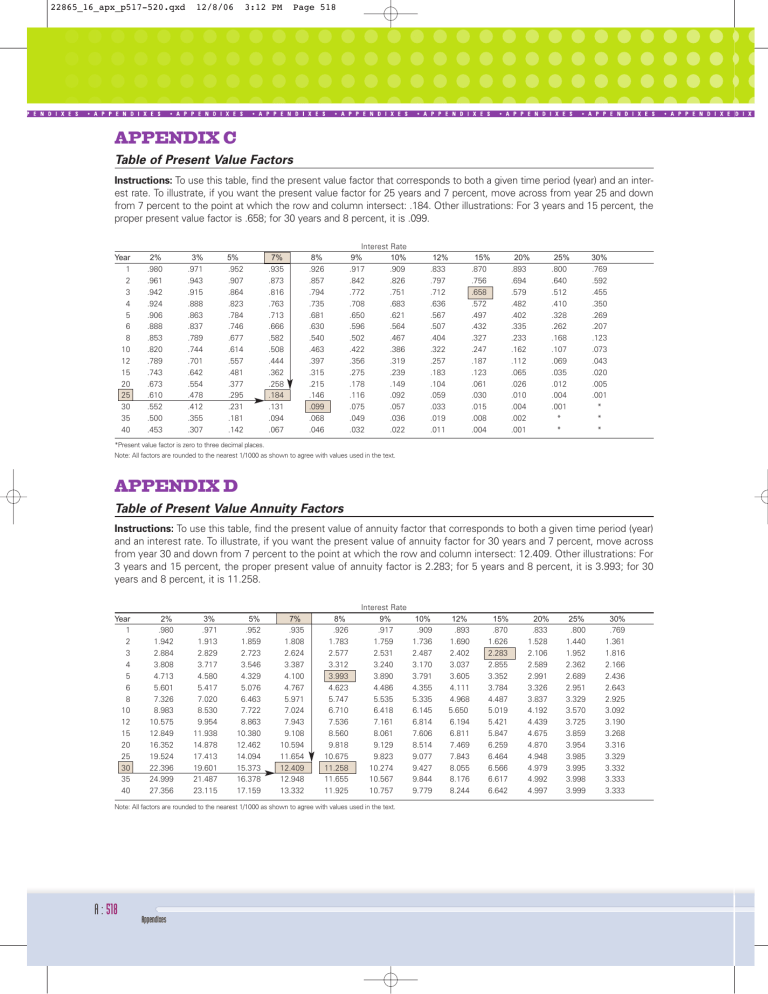
Instructions: To use this table, find the present value factor that corresponds to both a given time period (year) and an interest rate. To illustrate, if you want the present value factor for 25 years and 7 percent, move across from year 25 and down from 7 percent to the point at which the row and column intersect: .184. Other illustrations: For 3 years and 15 percent, the proper present value factor is .658; for 30 years and 8 percent, it is .099.
20
25
30
35
40
8
10
12
15
Interest Rate
Year 2% 3% 5% 7% 8% 9% 10% 12% 15% 20% 25% 30%
1
2
.980
.961
.971
.943
.952
.907
.935
.873
.926
.857
.917
.842
.909
.826
.833
.797
.870
.756
.893
.694
.800
.640
.769
.592
5
6
3
4
.942
.924
.906
.888
.915
.888
.863
.837
.864
.823
.784
.746
.816
.763
.713
.666
.794
.735
.681
.630
.772
.708
.650
.596
.751
.683
.621
.564
.712
.636
.567
.507
.658
.572
.497
.432
.579
.482
.402
.335
.512
.410
.328
.262
.455
.350
.269
.207
.853
.820
.789
.743
.673
.610
.552
.500
.453
.789
.744
.701
.642
.554
.478
.412
.355
.307
.677
.614
.557
.481
.377
.295
.231
.181
.142
.582
.508
.444
.362
.258
.184
.131
.094
.067
.540
.463
.397
.315
.215
.146
.099
.068
.046
.502
.422
.356
.275
.178
.116
.075
.049
.032
.467
.386
.319
.239
.149
.092
.057
.036
.022
.404
.322
.257
.183
.104
.059
.033
.019
.011
.327
.247
.187
.123
.061
.030
.015
.008
.004
.233
.162
.112
.065
.026
.010
.004
.002
.001
.168
.107
.069
.035
.012
.004
.001
*
*
.123
.073
.043
.020
.005
.001
*
*
*
*Present value factor is zero to three decimal places.
Note: All factors are rounded to the nearest 1/1000 as shown to agree with values used in the text.
APPENDIX D
Table of Present Value Annuity Factors
Instructions: To use this table, find the present value of annuity factor that corresponds to both a given time period (year) and an interest rate. To illustrate, if you want the present value of annuity factor for 30 years and 7 percent, move across from year 30 and down from 7 percent to the point at which the row and column intersect: 12.409. Other illustrations: For
3 years and 15 percent, the proper present value of annuity factor is 2.283; for 5 years and 8 percent, it is 3.993; for 30 years and 8 percent, it is 11.258.
20
25
30
35
40
8
10
12
15
Interest Rate
Year 2% 3% 5% 7% 8% 9% 10% 12% 15% 20% 25% 30%
1
2
.980
1.942
.971
1.913
.952
1.859
.935
1.808
.926
1.783
.917
1.759
.909
1.736
.893
1.690
.870
1.626
.833
1.528
.800
1.440
.769
1.361
5
6
3
4
2.884
3.808
4.713
5.601
2.829
3.717
4.580
5.417
2.723
3.546
4.329
5.076
2.624
3.387
4.100
4.767
2.577
3.312
3.993
4.623
2.531
3.240
3.890
4.486
2.487
3.170
3.791
4.355
2.402
3.037
3.605
4.111
2.283
2.855
3.352
3.784
2.106
2.589
2.991
3.326
1.952
2.362
2.689
2.951
1.816
2.166
2.436
2.643
7.326
8.983
10.575
12.849
16.352
19.524
22.396
24.999
27.356
7.020
8.530
9.954
11.938
14.878
17.413
19.601
21.487
23.115
6.463
7.722
8.863
10.380
12.462
14.094
15.373
16.378
17.159
5.971
7.024
7.943
9.108
10.594
11.654
12.409
12.948
13.332
5.747
6.710
7.536
8.560
9.818
10.675
11.258
11.655
11.925
5.535
6.418
7.161
8.061
9.129
9.823
10.274
10.567
10.757
5.335
6.145
6.814
7.606
8.514
9.077
9.427
9.844
9.779
4.968
5.650
6.194
6.811
7.469
7.843
8.055
8.176
8.244
4.487
5.019
5.421
5.847
6.259
6.464
6.566
6.617
6.642
3.837
4.192
4.439
4.675
4.870
4.948
4.979
4.992
4.997
3.329
3.570
3.725
3.859
3.954
3.985
3.995
3.998
3.999
2.925
3.092
3.190
3.268
3.316
3.329
3.332
3.333
3.333
Note: All factors are rounded to the nearest 1/1000 as shown to agree with values used in the text.
