11 Transportation Problems
advertisement
C
H
A
P
T
E
R
11
Transportation Problems
Learning Objectives:
Understanding the feature of Assignment Problems.
Formulate an Assignment problem.
Hungarian Method
Unbalanced Assignment Problems
Profit Maximization Problems
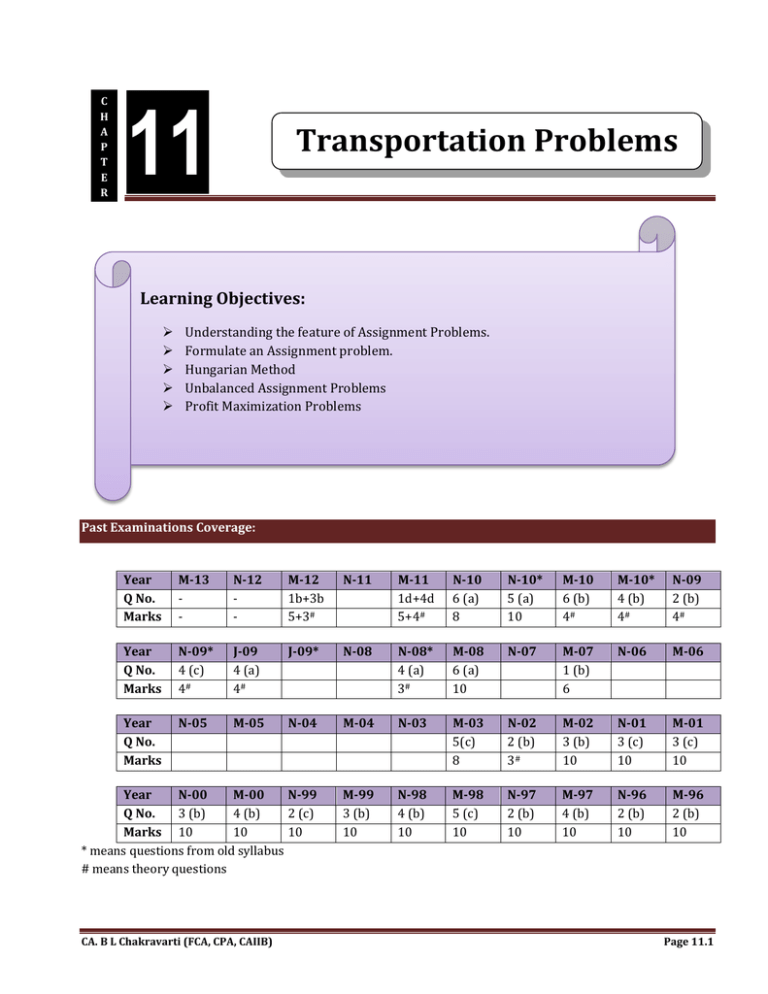
Past Examinations Coverage:
Year
Q No.
Marks
M-13
-
N-12
-
M-12
1b+3b
5+3#
N-11
M-11
1d+4d
5+4#
N-10
6 (a)
8
N-10*
5 (a)
10
M-10
6 (b)
4#
M-10*
4 (b)
4#
N-09
2 (b)
4#
Year
Q No.
Marks
N-09*
4 (c)
4#
J-09
4 (a)
4#
J-09*
N-08
N-08*
4 (a)
3#
M-08
6 (a)
10
N-07
M-07
1 (b)
6
N-06
M-06
Year
Q No.
Marks
N-05
M-05
N-04
M-04
N-03
M-03
5(c)
8
N-02
2 (b)
3#
M-02
3 (b)
10
N-01
3 (c)
10
M-01
3 (c)
10
Year
N-00
M-00
N-99
Q No.
3 (b)
4 (b)
2 (c)
Marks 10
10
10
* means questions from old syllabus
# means theory questions
M-99
3 (b)
10
N-98
4 (b)
10
M-98
5 (c)
10
N-97
2 (b)
10
M-97
4 (b)
10
N-96
2 (b)
10
M-96
2 (b)
10
CA. B L Chakravarti (FCA, CPA, CAIIB)
Page 11.1
Advance Management Accounting
Transportation:
The transportation problem is concerned with the allocation of items between suppliers (called origins) and
consumers (called destinations) so that the total cost of the allocation is minimized. The objective of the
transportation problems is to determine the quantity to be shipped from each source to each destinations so as
the transportation cost is lowest to maintain the supply and demand requirements.
Applications:
(i)
(ii)
(iii)
Minimize shipping costs from factories to warehouses (or from warehouses to retail outlets)
Determine lowest cost location for new factory; warehouse; office or other facility.
Find minimum cost production schedule that satisfies firm’s demand and production limitations
(called ‘Production Smoothing’)
Conditions: To use the transportation algorithm; the following conditions must be satisfied.
(i)
(ii)
(iii)
(iv)
The cost per item of each combination of origin and destination must be satisfied.
The supply of items at each origin must be known.
The requirement of items at each destination must be known.
The total supply must equal the total demand.
Stages in Transportation Problems: The transportation algorithm has four stages.
Stages -1: Arrange the data in table format and set up the transportation table to find any feasible allocation. A
feasible allocation is one in which all demand at the destinations is satisfied and all supply at the origin is
allocated.
Stages -2: Do preliminary check consist the following:
(i)
Verify Objective = Minimization. In case of Maximization or profit matrix, convert the same in to
opportunity loss matrix by subtracting each element from the highest element of the matrix.
Verify that the matrix is balanced i.e. Total Availability = Total Requirement. In case of
unbalanced matrix, a dummy column or dummy row should be introduced with nil transportation
cost.
(ii)
Stages -3: Develop an initial basic feasible solution (IBFS) by using any of the following methods.
(i)
(ii)
(iii)
Least Cost method.
North-West corner Method.
Vogel’s Approximation Method.
Stages -4: Test the IBFS solution for optimality. Modified Distribution (MODI) is the most common method and
widely used for test the optimality.
Stages -5: In case the IBFS solution is not optimal, develop the improved solutions.
1.
Email: @icai.org
Page 11.2
The Transportation Problems
Method 1:– North-West corner method: The practical steps in the North-West Corner cell are given below:
Step 1: Make maximum possible allocation to the upper-left corner cell (known as North-West corner cell) in
the first row depending upon the availability to supply for that row and demand requirement for the
column containing that cell.
Step 2: Move to the next cell of the first row depending upon remaining supply for that Row and the demand
requirement for the next column. Go on till the Row totally is exhausted.
Step 3: Move to the next row and make allocation to the cell below the cell of the preceding row in which the
last allocation was made and follow Step-1 and Step-2.
Step 4: Repeat the Step-1 to Step-3 till all requirements are exhausted i.e. entire demand and supply is
exhausted.
Method 2:- Least Cost Method : The practical steps involved in the Least Cost are given below:
Step 1: Make maximum possible allocation to the least cost cell depending upon the demand/supply for the
column/row containing that cell. In case of tie in the least cost cell, make allocation to the cell by which
maximum demand or capacity is exhausted.
Step 2: Make allocation to the second least cost cell depending upon the remaining demand/supply for the
column/row containing that cell.
Step 3: Repeat the Step-1 and Step-2 till all requirements are exhausted i.e. entire demand and supply is
exhausted.
Method 3:- Vogel’s Approximation Method: This methods uses penalty costs. For each row and column the
penalty cost is the difference between the cheapest available route and the next cheapest.
Step 1: To calculate the penalty cost for each row and column, we look at the least cost cell and next least cell.
For each row and column subtract the least cost cell from the next least cell. This gives the penalty cost
of not allocating into the cell with cheapest cost. Write the penalty cost of each row on the right-hand
side of the concerned row and penalty cost of each column on the below of the concerned column.
Step 2: We choose the row or column with the largest penalty cost and allocate as much as possible to the least
cost cell in that row or column depending upon the quantity available. In this way, the highest penalty
costs; are avoided as far as possible.
In case of tie between the penalty cost, select the row or column having least cost cell however in case of
tie even in the case of least cost cell; make allocation to that cell by which maximum requirement are
exhausted.
Step 3: Shade the row/column whose availability or requirement is exhausted so that it shall not be considered
for further allocation.
Step 4: Repeat the Step-1 to Step-3 till all requirements are exhausted i.e. entire demand and supply is
exhausted.
CA. B L Chakravarti (FCA, CPA, CAIIB)
Page 11.3
Advance Management Accounting
Optimality Test: It can be applied to a transportation table if it satisfies the following conditions:
a) It contains exactly m+n-1 allocations, where m & n represent the no. of rows & columns of the table.
{Note: (i) In case degeneracy occurs (i.e. allocations are less than m+n-1), infinitely small allocation(s) i.e. α
is/are introduced in least cost & independent cell to non-degenerate the solution. If least cost cell(s)
is/are not independent, then cell(s) with next lower cost(s) is/are chosen.
(ii) Degeneracy can occur at initial basic feasible solution or at a later stage. It may be removed once the
purpose is over.}
b) These allocations are independent i.e. loop can not be performed by them.
{Note: (i) Closed path or loop should have even no. of turns & is formed with an allocation on each corner,
which in turn is a join of horizontal & vertical (not diagonal) lines. A loop may not involve all the
allocations.
(ii) Generally, IBFS obtained by Northwest Corner rule or VAM are always in independent positions
though they may be m+n-1 or less than m+n-1 in no.}
The Stepping-Stone Method
1. Start with an arbitrary empty cell (a cell without allocation a.k.a. non-basic variables) and allocated +1
unit to this cell.
2. In order to maintain conditions of requirement & supply (a.k.a. rim constraints), 1 unit will be
deducted/added to basic variables (i.e. cells having allocations).
3. Calculate Net change (a.k.a. opportunity cost or net evaluation) in transportation cost as a result of this
perturbation.
4. Calculation Net evaluation for every empty cell.
5. If any cell evaluation is -ve, the cost can be reduced so that the solution under consideration can be
improved i.e. it is not optimal. On the other hand if all net evaluation are +ve, the given solution is
optimal one. If any net evaluation is Zero, the given solution is optimal but there exist other optimal
solutions as well.
6. If solution is not optimal, the cell with largest –ve opportunity cost should be selected & allocate
maximum units to this route (subject to rim constraints).
7. Iterate towards optimal solution, if further savings are possible.
Modified Distribution Method (MODI)
1. For the current IBFS (Initial Basic Feasible Solution) with m+n-1 occupied cell, calculate index numbers
(dual variables) Ui (i= 1,2,3,…m) and Vj (j= 1,2,3,…n) for rows and columns, respectively.
For calculating values of Ui andVj , the following relationship (formula) for occupied cells is used.
C ij = (Ui +Vj ) for all I,J.
2. Calculation Opportunity Cost for unoccupied cells by using the following formula:
∆ij = C ij - (Ui +Vj )
3. Examine unoccupied cells evaluation for all ∆ij.
(a) If ∆ij >0; then the cost of transportation will increase. i.e. and optimal solution has been arrived at.
(b) If ∆ij =0; then the cost of transportation will remain unchanged. But there exists are alternative
solution.
(c) If ∆ij <0; then an improved solution can be obtained by introducing cell (i,j) in the basis and go to
next step.
4.
Select an unoccupied cell with largest negative opportunity cost among all unoccupied cells.
1.
Email: @icai.org
Page 11.4
The Transportation Problems
5. Construct a closed path for the unoccupied cell determined in Step 7 and assign plus (+) and minus (-)
sign alternatively beginning with plus sign for the selected unoccupied cell in clock wise or the direction.
eg:ᶲ
7-ᶲ
10- ᶲ
5+ᶲ
ᶲmax i.e the maximum Qnty to be transferred
from occupied cell to unoccupied cell =
min of -ᶲ cells i.e. min of 7, 10 i.e. 7 units
6. Assign as many units as possible to the unoccupied cells satisfying rim conditions. The smallest
allocation in a cell with negative sign on the closed path indicated the number of units that can be
transported to the unoccupied cells. This quantity is added to all the occupied cells on the path marked
with plus sign and subtract from those cells on the path marked with minus sign.
7. Go to Step-2 and repeat procedure until all ∆ij >0 i.e. an optimal solution is reached. Calculate the
associated total transportation cost.
CA. B L Chakravarti (FCA, CPA, CAIIB)
Page 11.5
Advance Management Accounting
Theoretical Questions
Q 1:
Will the initial solution for a minimization problem obtained by Vogel’s Approximation Method and the
Least Cost Method be the same? Why?
[M 11,4d, 4M]
Q 2:
What do you mean by Degeneracy in transportation problem? How this can be solved?
Q 3:
Q 4:
Q 5:
Q 6:
Q 7:
1.
[M 10, 6b, 4M]
In an unbalanced minimization transportation problem, with positive unit transport costs from 3
factories to 4 destinations, it is necessary to introduce a dummy destination to make it a balanced
transportation problem. How will you find out if a given solution is optimal?
[M10, 4b, 4M]
[Ans.: No, Dummy destination won’t be introduced if total units available at factories = total units
required at destinations.]
[Nov-09 New]
How do you know whether an alternative solution exists for a transportation problem?
[N 09, 2b, 4M]
Explain the term degeneracy in a transportation problem.
[N 09*, 4c, 4M]
State the methods in which initial feasible solution can be arrived at in a transportation problem
[N 08 *, 4a, 4M]
What are the common methods of obtaining initial feasible solution in a transportation problem?
[N-02, 2b, 3M]
Email: @icai.org
Page 11.6
The Transportation Problems
Practical Questions
Q 1:
[SA-1]
Find Initial basis feasible solution by (i) North-West Corner Method; (ii) Least Cost Method; (iii) Vogel’s
Approximation Method (VAM) for the following transportation problem in the following cases.
(i)
When Cell entries represent the unit transportation cost
(ii)
When Cell entries represent the Contribution
Store
W1
W2
W3
W4
Supplies
Factory
F1
48
60
56
58
140
F2
45
55
53
60
260
F3
50
65
60
62
360
F4
52
64
55
61
220
Demand
200
320
250
210
Q 2: [SA-2]
Find Initial basis feasible solution by (i) North-West Corner Method; (ii) Least Cost Method; (iii) Vogel’s
Approximation Method (VAM) for the following transportation problem in the following cases.
(i)
When Cell entries represent the unit transportation cost
(ii)
When Cell entries represent the Contribution
Store
W1
W2
W3
Supplies
Factory
F1
48
60
56
140
F2
45
55
53
260
F3
50
65
60
360
F4
52
64
55
220
Demand
200
320
250
Q 3:
[SA-3]
Find Initial basis feasible solution by (i) North-West Corner Method; (ii) Least Cost Method; (iii) Vogel’s
Approximation Method (VAM) for the following transportation problem in the following cases.
(i)
When Cell entries represent the unit transportation cost
(ii)
When Cell entries represent the Contribution
Store
W1
W2
W3
W4
Supplies
Factory
F1
48
60
56
58
140
F2
45
55
53
60
260
F3
50
65
60
62
360
Demand
200
320
250
210
CA. B L Chakravarti (FCA, CPA, CAIIB)
Page 11.7
Advance Management Accounting
Q4:
[SM-1]
A company has factories at A, B and C which supply warehouse at D, E, F and G. Monthly factory capacities are
160, 150 and 190 units respectively. Monthly warehouse requirements are 80, 90, 110 and 160 units
respectively. Units shipping costs (in Rs.) are as follows:
To
From
A
B
C
Q 5:
D
E
F
G
42
40
39
48
49
38
38
52
40
37
51
43
[SM-2] [Multiple solution case]
Solve the following transportation problem
To
D1
D2
From
Q1
5
3
Q2
4
7
Q3
3
4
16
18
D3
D4
6
9
7
31
2
1
5
25
19
37
34
Q 6:
[SM-3] [MAXIMIZATION TRANSPORTATION PROBLEMS]
A company has 3 factories manufacturing the same product and 5 sole agencies in different parts of the country.
Production costs differ from factory to factory, and the sales prices from agency to agency. The shipping cost per
unit product from each factory to any agency is known. Given the following data, find the production and
distribution schedules most profitable to the company
Production
Max Capacity
Factory i
Cost/Unit
No. of Units
20
150
1
22
200
2
18
125
3
Cost
Agency j
Demand
Sales
1
9
4
1
80
30
1
7
5
2
100
32
5
8
3
3
75
31
9
3
2
4
45
34
4
6
7
5
125
29
Shipping
to be Met
Price
Q 7: [SM-4] [N-89] [Prohibited routes]
Solve the following transportation problem
Godown 1 Godown 2 Godown 3 Godown 4 Godown 5 Godown 6
Stock Availability
Factory- 1
7
5
7
7
5
3
60
Factory- 2
9
11
6
11
*
5
20
Factory- 3
11
10
6
2
2
8
90
Factory- 4
9
10
9
6
9
12
50
Demand
60
20
40
20
40
40
Note: It is not possible to transport any quantity from factory 2 to godown 5. State whether the solution derived
by you is unique.
1.
Email: @icai.org
Page 11.8
The Transportation Problems
[Ans.: Total Cost Rs. 1120]
Q 8:
[SM- 5]
The Link manufacturing company has several plants, three of which manufacture two principal products,
standard card table and deluxe card table. A new deluxe card table will be introduced which must be considered
in term of selling price & costs. The selling prices are: Standard Rs. 14.95, Deluxe Rs. 18.95, and new Deluxe Rs.
21.95.
Requirements
Variable costs
Available plant
capacity
Model
Quantity
Plant A
Plant B
Plant C
Plant
Capacity
Standard
450
8.00
7.95
8.10
A
800
Deluxe
1050
8.50
8.60
8.45
B
600
New
600
9.25
9.20
9.30
C
700
Deluxe
Solve this problem by the transportation technique for the greatest contribution.
Q 9:
[SM-6] [SA-35]
A company wishes to determine an investment strategy for each of the next four years. Five investment types
have been selected, investment capital has been allocated for each of the coming four years, and maximum
investment levels have been established for each investment type. An assumption is that amounts invested in
any year will remain invested until the end of the planning horizon of four years. The following table summaries
the data for this problem. The values in the body of the table represent net return on investment of one rupee up
to the end of the planning horizon. For example, a rupee invested in investment type B at the beginning of year 1
will grow to Rs. 1.90 by the end of the fourth year, yielding a net return of Rs. 0.90.
Investment made at Investment Type
Amount available
the beginning of year
(Rs. In ‘000)
A
B
C
D
E
1
0.80
0.90
0.60
0.75
1.00
500
2
0.55
0.65
0.40
0.60
0.50
600
3
0.30
0.25
0.30
0.50
0.20
750
4
0.15
0.12
0.25
0.35
0.10
800
Maximum
Rupee
Investment
750
600
500
800
1000
(Rs. In ‘000)
The objective is this problem is to determine the amount to be invested at the beginning of each year in an
investment type so as to maximize the net rupee return for the four-year period. Solve the above transportation
problem and get an optimal solution. Also calculate the net return on investment for the planning horizon for
four-year period.
[Ans: 1-E-₹ 500; 2-B-₹ 390; 3-D-₹ 375; 4-A-₹ 37.5; 4-C-₹ 125; 4-D-₹ 17.5; Total Return = ₹ 1445.]
CA. B L Chakravarti (FCA, CPA, CAIIB)
Page 11.9
Advance Management Accounting
Q 10: [SM-7] [N 96, 2b, 10M] [V2-E9] [Investment decision]
XYZ and co. has provided the following data seeking your advice on optimum investment strategy:
Beginning of the year Net Return Data (in paise) of Selected Investments
Amount available
(Lacs)
P
Q
R
S
1
95
80
70
60
70
2
75
65
60
50
40
3
70
45
50
40
90
4
60
40
40
30
30
Maximum
40
50
60
60
Investment (lacs)
The following additional information are also provided:
P, Q, R, and S represent the selected investments.
The company decided to have four years investment plan.
The policy of the company is that amount invested in any year will remain so until the end of the fourth
year.
The values (paise) in the table represent net return on investment of one Rupee till the end of the
planning horizon (for example, a Rupee invested in Investment P at the beginning of year 1 will grow to
Rs. 1.95 by the end of the fourth year, yielding a return of 95 paise).
Using the above, determine the optimum investment strategy.
Q 11: [SM-8] [N 97, 2b, 10M] [SA-30]
A particular product is manufactured in factories A, B, C and D; and is sold at centres 1, 2, and 3. The cost in Rs.
of product per unit and capacity in kgs per unit time of each plant is given below:
Factory
Cost (Rs.) per unit
Capacity (kgs) per unit
A
12
100
B
15
20
C
11
60
D
13
80
The sale price in Rs. per unit and the demand in kgs per unit time are as follows:
Sales Centre
Sale Price (Rs.) per unit Demand (kgs) per unit
1
15
120
2
14
140
3
16
60
Find the optimal sale distribution.
[Ans.:
From Factory To Sales Centre Quantity
A
1
100
B
2
20
C
3
60
D
1
20
D
2
60
Dummy
2
60
1.
Email: @icai.org
Total Profit
300
-20
300
40
60
0
680
Page 11.10
The Transportation Problems
Q 12: [SM-9] [M 98, 5c, 10M] [V2-3] [SA-24]
Consider the following data for the transportation problem:
Factory
Destination
1
2
A
5
1
B
6
4
C
3
2
Demand
75
20
Supply to be exhausted
3
7
5
5
50
10
80
15
Since there is not enough supply, some of the demands at the three destinations may not be satisfied. For the
unsatisfied demands, let the penalty costs be rupees 1,2 and 3 for destinations (1), (2) and (3) respectively. Find
the optimal allocation that minimizes the transportation and penalty cost.
Q 13: [SM-10] [N 98, 4b, 10M] [SA-34]
ABC Enterprises is having three plants manufacturing dry-cells, located at different locations. Production cost
differs from plant to plant. There are five sales offices of the company located in different regions of the country.
The sales prices can differ from region to region. The shipping cost from each plant to each sales office and other
data are given by following table:
Production Data Table
Production cost per unit
Max Capacity in no. of units
Plant no.
20
150
1
22
200
2
18
125
3
Shipping Cost and Demand & Sales Prices table
Shipping Cost
Sales Office 1
Sales Office 2
Sales Office 3
Sales Office 4
Sales Office 5
Plant 1
1
1
5
9
4
Plant 2
9
7
8
3
6
Plant 3
4
5
3
2
7
Demand and Sales Price
Sales Office 1
Sales Office 2
Sales Office 3
Sales Office 4
Sales Office 5
Demand
80
100
75
45
125
Sales Price
30
32
31
34
29
Find the production and distribution schedule most profitable to the company.
[Ans.:
Plant
1
1
2
2
2
3
3
3
Sales Office
1
2
4
5
Dummy
1
3
4
CA. B L Chakravarti (FCA, CPA, CAIIB)
Units
50
100
25
125
50
30
75
20
Total Profit (Rs.)
450
1100
225
125
0
240
750
280
Total 3170
Page 11.11
Advance Management Accounting
Q 14: [SA-19]
Find Initial basic feasible solution by Vogel’s Approximation Method. Is the number of allocation equal to m+n1’if no, how will you deal with this situation?
Store
W1
W2
W3
W4
Supplies
Factory
F1
1
2
4
4
6
F2
4
3
2
0
8
F3
0
2
2
1
10
Demand
4
6
8
6
Note: Cell entries represent the unit transportation cost
Q 15: [SA-20] [Number of allocation = m+n-1]
Test the following Initial basic solution for Optimality.
Store W1
W2
W3
Factory
F1
60
30
48
60
56
F2
260
45
55
53
F3
200
50
65
60
F4
220
52
64
55
Demand
200
320
250
W4
Supplies
50
58
140
260
60
160
62
360
220
61
210
Note: Cell entries represent the unit transportation cost
Q 16: [SA-21] [Number of allocation < m+n-1]
Test the following Initial basic solution for Optimality.
Store W1
W2
W3
Factory
F1
e
6
1
2
4
F2
4
3
2
F3
4
0
2
2
Demand
4
6
8
W4
Supplies
6
4
2
6
0
1
6
8
10
6
Note: Cell entries represent the unit transportation cost
1.
Email: @icai.org
Page 11.12
The Transportation Problems
Q 17: [SA-22]
Solve the following transportation problem with the restriction that nothing can be transported from F2 to W3.
Store
W1
W2
W3
W4
Supplies
Factory
F1
15
4
6
6
1
F2
4
7
3
2
F3
11
3
9
2
4
Required
10
5
10
5
Note: Cell entries represent the unit transportation cost
Q 18: [SA-36]
Solve the following transportation problem to maximize profit and give criteria for optimality:
Store Profit (₹)/Unit Destination
Supplies
Origin
1
2
3
4
A
40
25
22
33
100
B
44
35
30
30
30
C
36
38
28
30
70
Demand
40
20
60
30
Q 19: [SA-37]
Solve the following transportation problem:
1
2
3
4
5
Demand
1
73
62
96
57
56
2
40
93
65
58
23
3
9
96
80
29
87
4
79
8
50
12
18
5
20
13
65
87
12
6
8
10
4
4
Stock
Available
8
7
9
3
5
Q 20: [SA-27]
Consider the following transportation cost table. The costs are given in Rupees, the supply and demand are in
units. Determine the optimal solution:
Destination
Supply
Source
1
2
3
4
5
I
40
36
26
38
30
160
II
38
38
26
34
198
280
III
36
38
34
24
30
240
Demand
160
160
200
120
240
CA. B L Chakravarti (FCA, CPA, CAIIB)
Page 11.13
Advance Management Accounting
Q 21: [SA-25]
Solve the following transportation cost table for minimum cost:
Origins
Destinations
A
B
C
I
7
4
3
II
3
2
7
III
4
4
3
IV
9
7
5
Availabilities
12
8
35
Q 22: [SA-23]
Solve the following transportation cost table for minimum cost:
Godowns
Factory
1
2
3
I
7
5
7
II
9
11
6
III
11
10
6
IV
9
10
9
Demand
60
20
40
Requirements
D
4
5
7
3
15
25
20
40
25
4
7
11
2
6
5
5
2
9
6
3
5
8
12
20
40
40
Stock
Available
60
20
90
50
Note: It is not possible to transport any quantity from factor 2 to Godown 5.
Required: State whether the solution derived by you is unique.
Q 23: [V2-E2] [SA-32]
A Company has four factories F1, F2, F3 and F4, manufacturing the same product. Production and raw material
costs differ from factory to factory and are given in the first two rows of the following table. The Transportation
costs from the factories to sales depots S1, S2 and S3 are given in the next three rows of the table. The
production capacity of each factory is given in the last row.
The last two columns in the table given the sales price and the total requirement at each depot:
Item Per unit
Factory
Sales price Per unit
Requirement
F1
F2
F3
F4
Production cost
15
18
14
13
Raw material cost
10
9
12
9
3
9
5
4
34
80
Transportation cost
1
7
4
5
32
120
5
8
3
6
31
150
Production capacity
10
150
50
100
Determine the most profitable production and distribution schedule and the corresponding profit. The surplus
should be taken to yield zero profit.
[Ans:Profit associated with the optimum Program is Rs. 480.]
Q 24: [SA-28] [N 90]
Stronghold Construction Company is interested in taking loans from banks for some of its projects P, Q, R, S and
T. The rates of interest and the lending capacity differ from bank to bank. All these projects are to be completed.
The relevant details are provided in the following table. Assuming the role of a consultant, advise this company
1.
Email: @icai.org
Page 11.14
The Transportation Problems
as to how it should take the loans so that the total interest payable will be the least. Are there alternative
optimum solutions? If so, indicate one such solution.
Bank
Pvt. Bank
Nationalized
Co-Operative
Amount
Required
(₹’000)
P
40
38
36
160
Interest Rate in Percentage for Project
Q
R
S
36
26
38
38
26
34
38
34
24
160
200
120
T
30
198
30
Max. Credit
(₹’000)
Any Amount
400
250
240
Q 25: [SA-29]
A Manufacturer of jeans is interested in developing an advertising campaign that will reach four different age
groups. Advertising campaigns can be conducted through TV, Radio and Magazines. The following table gives the
estimated cost in paise per exposure for each age group according to the medium employed. In addition,
maximum exposure levels possible in each of the media, namely TV, Radio and Magazines are 40, 30 and 20
million respectively. Also the minimum desired exposures within each age group namely 13-18, 19-25, 26-35, 36
and older are 30, 25, 15 and 10 million. The objective is to minimum exposure level in each age group.
Media
13-18
TV
Radio
Magazines
12
10
14
Age Group
19-25
26-35
7
9
12
10
12
9
36 &
Older
10
10
12
Required:
(i)
(ii)
Formulate the above as a transportation problem, and find the optimal solution.
Solve this problem if the policy is to provide at least 4 million exposures through TV in the 13-18 age
group and at least 8 million exposures through TV in the age group 19-25.
CA. B L Chakravarti (FCA, CPA, CAIIB)
Page 11.15
Advance Management Accounting
Practical Questions – Previous Examinations Paper
Q:
[M 11, 1d, 5M]
The following matrix is a minimization problem for transportation cost. The unit transportation costs are given
at the right hand corners of the cells and the ∆ij values are encircled.
D1
D2
D3
D4
Supply
3
4
4
F1
500
9
6
7
F2
300
8
300
4
F3
2
6
5
200
Demand
0
2
200
300
400
300
1000
Find the optimum solution (s) and the minimum cost.
[Ans:
(i)
F1-D1-300 ₹ 900; F1-D2-100 ₹ 400; F1-D3-100 ₹ 400; F2-D2-300 ₹ 1800; F3-D3-200 ₹ 1000; Total Cost = ₹ 4500.
(ii)
F1-D1-100 ₹ 300; F1-D2-100 ₹ 400; F1-D3-300 ₹ 1200; F2-D2-300 ₹ 1800; F3-D3-200 ₹ 800; Total Cost = ₹ 4500
Q:
[N 10, 6a, 8M]
A company has three plants located at A, B and C. The production of these plants is absorbed by four distribution
centres located at X, Y, W and Z. the transportation cost per unit has been shown in small cells in the following
table:
Distribution Centre
Factories
X
A
B
C
Demand
4000
Y
W
Z
Supply
(Units)
6
9
13
7
6
10
11
5
4
7
14
8
4000
4500
5000
6000
6000
6000
18000
17500
Find the optimum solution of the transportation problem by applying Vogel’s Approximation Method.
[Ans: Total Cost ₹ 129500]
1.
Email: @icai.org
Page 11.16
The Transportation Problems
Q:
[N 10*, 5a,10M]
A company has 3 factories F1, F2 and F3 which supply the same product to 5 agencies, A1, A2, A3, A4 and A5.
Unit production costs, shipping costs and selling prices differ among the different sources and destinations and
are given below:
F1
F2
F3
Production Cost (`/Unit)
28
35
29
Production Capacity (No. of units)
110
240
125
Agencies
A1
Selling Price (`/Unit) 40
Demand (No. of units) 80
A2
48
100
A3
42
75
A4
45
45
A5
41
125
Shipping Costs/Unit
A1
A2
A3
A4
A5
F1
3
9
8
12
8
F2
6
10
6
2
5
F3
3
10
3
6
8
(i) Set up the initial transportation matrix for minimization.
(ii) After doing (i) above, you are given the following additional information:
(a) 40 units must be transported from F2 to A2 as per an earlier agreement made by F2 with A2’s customer.
This quantity is included in the figures given for total production and demand at these locations.
(b) Not more than 30 units may be sent from F1 to A1, since the transporter’s vehicle lacks space in this
route.
Incorporating conditions (a) and (b) above, obtain the initial solution by Vogel’s Approximation Method.
(Do not attempt to continue for the full and final solution.)
Q:
[M 09, 4a, 6M] [V2-10][ Minimization-balanced-degeneracy]
The cost per unit of transporting goods from factories X, Y, Z to destinations A, B and C, and the quantities
demanded and supplied are tabulated below. As the company is working out the optimum logistics, the Govt. has
announced a fall in oil prices. The revised unit costs are exactly half the costs given in the table. You are required
to evaluate the minimum transportation cost.
Factories\Destinations
A
B
C
Supply
X
15
9
6
10
Y
21
12
6
10
Z
6
18
9
10
Demand
10
10
10
30
[Ans.: Min. transportation cost is ₹. 105]
Q:
[M 08, 6a, 10M] [V2-8] [SA-27]
Goods manufactured at 3 plants, A, B and C are required to be transported to sales outlets X, Y and Z. The unit
costs of transporting the goods from the plants to the outlets are given below:
Sales outlets\Plants A
B
C
Total Demand
X
3
9
6
20
Y
4
4
6
40
Z
8
3
5
60
Total supply
40
50
30
120
CA. B L Chakravarti (FCA, CPA, CAIIB)
Page 11.17
Advance Management Accounting
You are required to:
i.
Compute the initial allocation by North-West Corner Rule.
ii.
Compute the initial allocation by Vogel’s approximation method and check whether it is optional.
iii.
State your analysis on the optionality of allocation under North-West corner Rule and Vogel’s
Approximation method.
[Ans: (i) A-X-20 ₹ 60; A-Y-20 ₹ 80; B-Y-20 ₹80; B-Z-30 ₹ 90; C-Z-30 ₹ 150; Total Cost = ₹ 460
(ii) A-X-20 ₹ 60; A-Y-20 ₹ 80; B-Z-50 ₹80; C-Y-20 ₹ 120; C-Z-10 ₹ 100; Total Cost = ₹ 460
(iii)The solution under VAM is optimal with a zero in R2C2 which means that the cell C2R2 which means that the
cell C2R2 can come into solution, which will be another optimal solution. Under NWC rule the initial allocation
had C2R2 and the total cost was the same Rs. 460 as the total cost under optimal VAM solution. Thus, in this
problem, both methods have yielded the optimal solution under the 1st allocation. If we do an optimality test for
the solution, we will get a zero for ∆ij in C3R2 indicating the other optimal solution which was obtained under
VAM.]
Q: [M 07, 1b, 6M] [V2-7]
The initial allocation of a transportation problem, along with the unit cost of transportation from each origin to
destination is given below. You are required to arrive at the minimum transportation cost by the Vogel’s
Approximation method and check for optimality.
(Hint: Candidates may consider u1 = 0 at Row 1 for initial cell evaluation)
Requirement
8
11
6
4
2
8
6
2
9
12
9
6
18
10
10
9
8
8
7
6
3
7
2
7
2
4
9
Availability
12
3
5
6
11
8
8
8
4
40
[Ans: Minimum Transportation Cost ₹ 204]
Q:
[M-03, 5c, 10M][ Maximization-unbalanced]
A company has three factories and four customers. The company furnishes the following schedule of profit per
unit on transportation of its goods to the customers in rupees:
Customers
Factory
A
B
C
D
Supply
P
40
25
22
33
100
Q
44
35
30
30
30
R
38
38
28
30
70
Demand
40
20
60
30
1.
Email: @icai.org
Page 11.18
The Transportation Problems
You are required to solve the transportation problem to maximize the profit and determine the resultant of
optimal profit.
[Ans.: Maximum Profit ₹. 5130]
Q:
[M-02, 3b, 10M] [V2 -1][ Minimization-Unbalanced]
A product is manufactured by four factories A, B, C & D. The unit production costs are Rs. 2, Rs. 3, Re. 1 and Rs. 5
respectively. Their daily production capacities are 50, 70, 30 and 50 units respectively. These factories supply
the product to four stores P, Q, R, S. The demand made by these stores are 25, 35, 105 and 20 units respectively.
Unit transportation cost in rupees from each factory to each store is given in the following table:
Stores
Factories
P
Q
R
S
A
2
4
6
11
B
10
8
7
5
C
13
3
9
12
D
4
6
8
3
Determine the extent of deliveries from each of the factories to each of the stores so that the total cost
(production and transportation together) is minimum.
[Ans.: Total Cost ₹ 1465]
Q:
[N 01, 3c, 10] [V2 -2] Multiple Optimal Solutions
A Compressed Natural Gas (CNG) company has three plants producing gas and four outlets. The cost of
transporting gas from different production plants to the outlets, production capacity of each plant &
requirement at different outlet is shown in the following cost-matrix table.
Outlets
Plants
A
B
C
D
Capacity of Production
X
4
6
8
6
700
Y
3
5
2
5
400
Z
3
9
6
5
600
Requirement 400
450
350
500
1700
Determine a transportation schedule so that the cost is minimized. The cost in the cost-matrix is given in
thousand of rupees.
[Ans.: Minimum costs ₹ 7350 thousands]
Q:
[M 01, 3c, 10M]
A company has 3 plants and 3 warehouses. The Cost of sending a unit from different plants to the warehouses,
production at different plants and demand at different warehouses are shown in the following cost matrix table:
Warehouses
Plants
A
B
C
Production
X
8
16
16
152
Y
32
48
32
164
Z
16
32
48
154
Demand
144
204
82
Determine a transportation schedule, so that the cost is minimized. Assume that the cost in the cost matrix is
given in thousand of rupees.
[Ans.: X-B-152 ₹ 2432; Y-B-42 ₹ 2016; Y-C-82 ₹ 2624; Y-dummy-40 ₹ 0; Z-A-144 ₹ 2304; Z-B-10 ₹ 320; Total Cost =
₹ 9696]
CA. B L Chakravarti (FCA, CPA, CAIIB)
Page 11.19
Advance Management Accounting
Q:
[N 00, 3b, 10M] [V2-E4]
Following is the profit matrix based on four factories and three sales depots of the company:
S1
S2
S3
Availability
F1
6
6
1
10
Factories
F2
-2
-2
-4
150
F3
3
2
2
50
F4
8
5
3
100
Requirement
80
120
150
Determine the most profitable distribution schedule and the corresponding profit, assuming no profit in case of
surplus production.
[Ans: Total Profit = ₹ 480]
Q:
[M 00, 4b, 10M] [V2-E5]
A company produces a small component for all industrial products and distributes it to five wholesalers at a
fixed prices of Rs.2.50 per unit. Sales forecasts indicate that monthly deliveries will be 3,000, 3,000, 10,000,
5,000 and 4,000 units to wholesalers 1,2,3,4 and 5 respectively. The monthly production capabilities are 5,000,
10,000, 12,500 at plants 1, 2 and 3 respectively. The direct costs of production of each unit are Rs.1.00 and
Rs.0.80 at plants 1, 2 and 3 respectively. The transportation costs of shipping a unit from a plant to a wholesaler
are given below:
Wholesaler
1
2
3
4
5
1
0.05 0.07
0.10
0.15
0.15
Plant 2
0.08
0.06
0.09
0.12
0.14
3
0.10
0.09
0.08
0.10
0.15
Find how many components each plant supplies to each wholesaler in order to maximize profit.
[ Ans: Profit ₹ 32520]
Q:
[N 99, 2c, 10M] [V2-E6]
The following table shows all the necessary information on the available supply to each warehouse, the
requirement of each market and the unit transportation cost from each warehouse to each market:
Market
I
II
III
IV
Supply
A
5
2
4
3
22
Warehouse
B
4
8
1
6
15
C
4
6
7
5
8
Requirement
7
12
17
9
The shipping clerk has worked out the following schedule from his experience:
12 Units
from A to II
1 Unit
from A to III
9 Units
from A to IV
15 Units
from B to III
7 Units
from C to I and
1 Unit
from C to III
You are required to answer the following:
(i) Check and see if the clerk has the optimal schedule;
(ii) Find the optimal schedule and minimum total shipping cost; and
1.
Email: @icai.org
Page 11.20
The Transportation Problems
(iii) If the clerk is approached by a carrier of route C to II, who offers to reduce his rate in the hope of getting
some business, by how much should the rate be reduced before the clerk should consider giving him an order?
[Ans: (i) Clerk has not worked out the optimal schedule; (ii) Minimum total shipping cost ₹ 104; (iii) Total Shipping
Cost = Rs.103]
Q:
[M 99, 3b, 10M] [V2-E7]
A company has three warehouses W1, W2 and W3. It is required to deliver a product from these warehouses to
three customers A, B and C. There warehouses have the following units in stock.
Warehouse:
W1
W2
W3
No. of units:
65
42
43
and customer requirements are:
Customer:
A
B
C
No. of units:
70
30
50
The table below shows the costs of transporting one unit from warehouse to the customer:
Warehouse
W1
W2
W3
A
5
7
8
Customer
B
4
4
6
C
6
7
7
Find the optimal transportation route.
Answer Total Cost = Rs. 830
[Ans.: W1-A-65 ₹ 325; W2-A-5 ₹ 35; W2-B-30 ₹ 120; W2-C-7 ₹ 49; W3-C-43 ₹ 301; Total Cost = ₹ 680]
Q:
[N 98, 4b, 10M] [SM-10] [SA-34]
ABC Enterprises is having three plants manufacturing dry-cells, located at different locations. Production cost
differs from plant to plant. There are five sales offices of the company located in different regions of the country.
The sales prices can differ from region to region. The shipping cost from each plant to each sales office and other
data are given by following table:
Production Data Table
Production cost per unit
Max Capacity in no. of units
Plant no.
20
150
1
22
200
2
18
125
3
Shipping Cost and Demand & Sales Prices table
Shipping Cost
Sales Office 1
Sales Office 2
Sales Office 3
Sales Office 4
Sales Office 5
Plant 1
1
1
5
9
4
Plant 2
9
7
8
3
6
Plant 3
4
5
3
2
7
Demand and Sales Price
Sales Office 1
Sales Office 2
Sales Office 3
Sales Office 4
Sales Office 5
Demand
80
100
75
45
125
Sales Price
30
32
31
34
29
Find the production and distribution schedule most profitable to the company.
[Ans.: 1-1-50 ₹ 450; 1-2-100 ₹ 1100; 2-4-25 ₹ 225; 2-5-125 ₹ 125; 2-dummy-50 ₹0; 3-1-30 ₹ 240; 3-3-75 ₹ 750; 34-20 ₹ 280; Total Profit = ₹ 3170]
CA. B L Chakravarti (FCA, CPA, CAIIB)
Page 11.21
Advance Management Accounting
Q: [M 98, 5c, 10M] [SM-9] [V2-3] [SA-24]
Consider the following data for the transportation problem:
Factory
Destination
1
2
3
A
5
1
7
B
6
4
5
C
3
2
5
Demand
75
20
50
Supply to be exhausted
10
80
15
Since there is not enough supply, some of the demands at the three destinations may not be satisfied. For the
unsatisfied demands, let the penalty costs be rupees 1,2 and 3 for destinations (1), (2) and (3) respectively. Find
the optimal allocation that minimizes the transportation and penalty cost.
[Ans.: A-2-10 ₹ 10; B-1-20 ₹ 120; B-2-10 ₹ 40; B-3-50 ₹ 300; C-1-15 ₹45; Dummy-1-40 ₹ 40; Total Cost = ₹ 555]
Q:
[N 97, 2b, 10M] [SM-8] [SA-30]
A particular product is manufactured in factories A, B, C and D; and is sold at centres 1, 2, and 3. The cost in Rs.
of product per unit and capacity in kgs per unit time of each plant is given below:
Factory
Cost (Rs.) per unit
Capacity (kgs) per unit
A
12
100
B
15
20
C
11
60
D
13
80
The sale price in Rs. per unit and the demand in kgs per unit time are as follows:
Sales Centre
Sale Price (Rs.) per unit Demand (kgs) per unit
1
15
120
2
14
140
3
16
60
Find the optimal sale distribution.
[Ans.: A-1-100 ₹ 300; B- 2-20 ₹ -20; C-3-60 ₹ 300; D-1-20 ₹ 40; D-1-60 ₹60; Dummy-2-60 ₹ 0;Total Profit = ₹ 680]
Q:
[M 97,4b, 10M] [V2-E10][ Minimization-balanced-degeneracy]
A company has four terminals U, V, W, and X. At the start of a particular day 10, 4, 6, and 5 trailers respectively
are available at these terminals. During the previous night 13, 10, 6, and 6 trailers respectively were loaded at
plants A, B, C, and D. The company dispatcher has come up with the costs between the terminals and plants as
follows:
Plants
Terminals
A
B
C
D
U
20
36
10
28
V
40
20
45
20
W
75
35
45
50
X
30
35
40
25
Find the allocation of loaded trailers from plants to terminals in order to minimize transportation cost.
[Ans: U-A ₹ 80; U- C₹ 60; V-B ₹ 60; V-D ₹ 20; W-B ₹210; X-D ₹ 125;Terminal Plant Cost = ₹555]
1.
Email: @icai.org
Page 11.22
The Transportation Problems
Q:
[N 96, 2b, 10M] [SM-7] [V2-E9] [Investment decision]
XYZ and co. has provided the following data seeking your advice on optimum investment strategy:
Beginning of the year Net Return Data (in paise) of Selected Investments
Amount
Available (Lacs)
P
Q
R
S
1
95
80
70
60
70
2
75
65
60
50
40
3
70
45
50
40
90
4
60
40
40
30
30
Maximum
40
50
60
60
Investment (lacs)
The following additional information are also provided:
P, Q, R, and S represent the selected investments.
The company decided to have four years investment plan.
The policy of the company is that amount invested in any year will remain so until the end of the fourth
year.
The values (paise) in the table represent net return on investment of one Rupee till the end of the
planning horizon (for example, a Rupee invested in Investment P at the beginning of year 1 will grow to
Rs. 1.95 by the end of the fourth year, yielding a return of 95 paise).
Using the above, determine the optimum investment strategy.
[Ans: Net Return ₹ 130.00 lacs]
Q:
[M 96, 2b, 10M] [V2 –E8] [SA-33]
A company has four factories situated in four different locations in the country and four sales agencies located in
four other locations in the country. The cost of production (Rs. Per unit), the sales price (Rs. per unit), and
shipping cost (Rs. Per unit) in the case of matrix, monthly capacities and monthly requirements are given below:
Factory
Sales Agency
1
7
3
4
8
8
2
5
5
6
7
12
Monthly
Capacity
(Units)
3
6
4
4
6
18
4
4
2
5
5
22
A
10
B
15
C
20
D
15
Monthly
Requirement
Sale Price
20
22
25
18
Find the monthly production and distribution schedule which will maximize profit.
[Total Profit = ₹ 155]
CA. B L Chakravarti (FCA, CPA, CAIIB)
Cost
of
Production
10
15
16
15
Page 11.23
Advance Management Accounting
Q:
[May-95] [SA-31]
A leading firm has three auditors. Each auditor can work up to 160 hours during the next month, during which
time three projects must be completed. Project 1 will 130 hours, project 2 will take 140 hours, and project 3 will
take 160 hours. The amount per hour that can be billed for assigning each auditor to each project is given in
Table 1:
Table1
Project
Auditor
1
2
3
Rs.
Rs.
Rs.
1
1200 1500 1900
2
1400 1300 1200
3
1600 1400 1500
Formulate this as a transportation problem and find the optimal solution. Also find out the maximum total
billings during the next month.
[Ans: 1-3 ₹ 304000; 2- 2 ₹ 143000; 3-1 ₹ 208000; 3-2 ₹ 4 2000; Total Billing= ₹ 697000]
Important Notes
1.
Email: @icai.org
Page 11.24

