WHAT’S YOUR ‘PEF’? by Simon Shane
advertisement
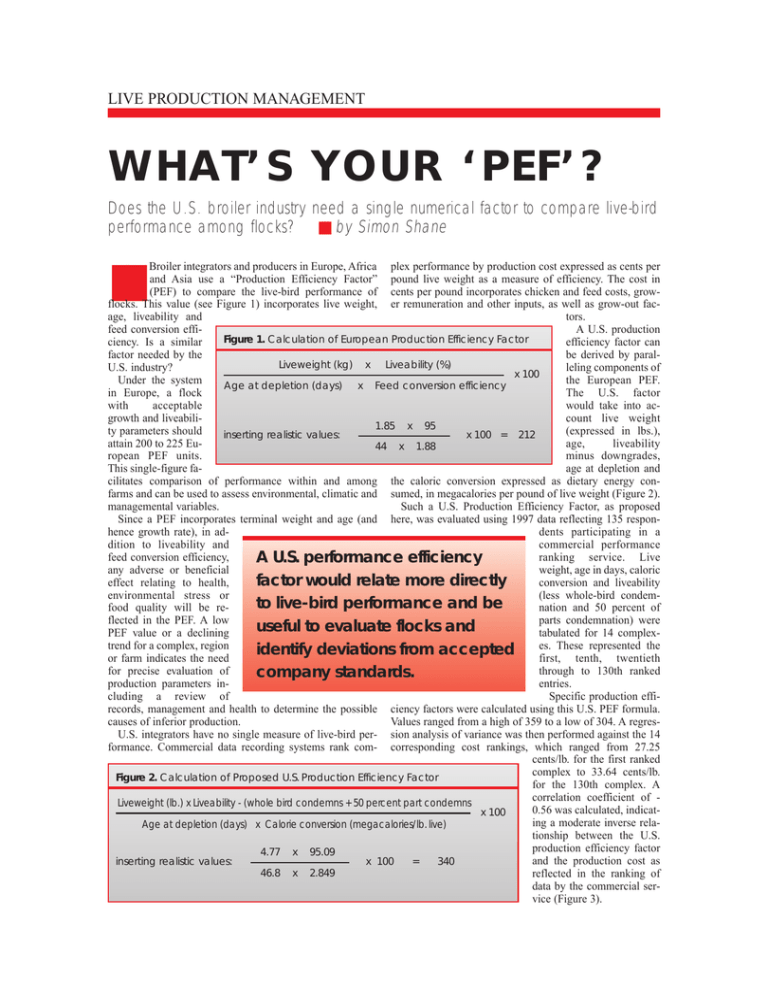
LIVE PRODUCTION MANAGEMENT WHAT’S YOUR ‘PEF’? Does the U.S. broiler industry need a single numerical factor to compare live-bird performance among flocks? ■ by Simon Shane ■ Broiler integrators and producers in Europe, Africa plex performance by production cost expressed as cents per and Asia use a “Production Efficiency Factor” pound live weight as a measure of efficiency. The cost in (PEF) to compare the live-bird performance of cents per pound incorporates chicken and feed costs, growflocks. This value (see Figure 1) incorporates live weight, er remuneration and other inputs, as well as grow-out facage, liveability and tors. feed conversion effiA U.S. production Figure 1. Calculation of European Production Efficiency Factor ciency. Is a similar efficiency factor can factor needed by the be derived by paralLiveweight (kg) x Liveability (%) U.S. industry? leling components of x 100 Under the system the European PEF. Age at depletion (days) x Feed conversion efficiency in Europe, a flock The U.S. factor with acceptable would take into acgrowth and liveabilicount live weight 1.85 x 95 ty parameters should (expressed in lbs.), inserting realistic values: x 100 = 212 attain 200 to 225 Euage, liveability 44 x 1.88 ropean PEF units. minus downgrades, This single-figure faage at depletion and cilitates comparison of performance within and among the caloric conversion expressed as dietary energy confarms and can be used to assess environmental, climatic and sumed, in megacalories per pound of live weight (Figure 2). managemental variables. Such a U.S. Production Efficiency Factor, as proposed Since a PEF incorporates terminal weight and age (and here, was evaluated using 1997 data reflecting 135 responhence growth rate), in addents participating in a dition to liveability and commercial performance feed conversion efficiency, ranking service. Live A U.S. performance efficiency any adverse or beneficial weight, age in days, caloric factor would relate more directly effect relating to health, conversion and liveability environmental stress or (less whole-bird condemto live-bird performance and be food quality will be renation and 50 percent of flected in the PEF. A low parts condemnation) were useful to evaluate flocks and PEF value or a declining tabulated for 14 complextrend for a complex, region es. These represented the identify deviations from accepted or farm indicates the need first, tenth, twentieth for precise evaluation of through to 130th ranked company standards. production parameters inentries. cluding a review of Specific production effirecords, management and health to determine the possible ciency factors were calculated using this U.S. PEF formula. causes of inferior production. Values ranged from a high of 359 to a low of 304. A regresU.S. integrators have no single measure of live-bird per- sion analysis of variance was then performed against the 14 formance. Commercial data recording systems rank com- corresponding cost rankings, which ranged from 27.25 cents/lb. for the first ranked complex to 33.64 cents/lb. Figure 2. Calculation of Proposed U.S. Production Efficiency Factor for the 130th complex. A correlation coefficient of Liveweight (lb.) x Liveability - (whole bird condemns + 50 percent part condemns 0.56 was calculated, indicatx 100 ing a moderate inverse relaAge at depletion (days) x Calorie conversion (megacalories/lb. live) tionship between the U.S. production efficiency factor 4.77 x 95.09 and the production cost as inserting realistic values: x 100 = 340 46.8 x 2.849 reflected in the ranking of data by the commercial service (Figure 3). WHAT’S YOUR ‘PEF’? Figure 3. Comparison of Ranking of 14 Complexes on cost, Compared to Proposed U.S. Production Efficiency factor (PEF) Complex Rank Cost, cent/lb. U.S. PEF 1 10 20 30 40 50 60 70 80 90 100 110 120 130 27.28 28.49 28.88 29.13 29.33 29.62 29.92 30.25 30.59 31.00 31.31 31.56 32.76 33.64 359 320 320 353 342 331 354 329 304 330 321 357 291 304 mean 30.269 ± 1.703 329.6 ± 21.44 correlation coefficient = -0.562 A second evaluation was based on the nine sub-regions comprising eight to 16 complexes incorporating the data from 107 respondents. This analysis generated a mean PEF value of 329.1 with a standard deviation of 5.79. The range of values was 324 to 340. As with the previous analysis, a correlation coefficient of -0.38 confirmed the absence of a statistical relationship between live cost (cents/lb.) and the proposed U.S. production efficiency factor calculated from the live-bird parameters. A single value incorporating live weight, age at depletion, caloric conversion and product of acceptable quality for processing (liveability minus condemnations) could be used in the USA to compare the performance of flocks. The negative correlation between cost ranking by a commercial service and the U.S. PEF is attributable to factors other than performance which influence the absolute cost of production and relative rank. Considering only the live weight cost expressed as cents per pound limits the scope of live-bird evaluation. It is possible for managers to apply the cost data to compare complexes within a specific area of operation, or during a given season, provided that appropriate interpretation is applied, and with similar accounting conventions, non-biased data and cost structures. Such a U.S. PEF relates more directly to live-bird performance and, based on the experience with application of the European PEF, would be useful to live-bird managers and health professionals in evaluating flocks and identifying deviations from accepted company standards. ■ Dr. Simon M. Shane, Louisiana State University and Agricultural and Mechanical College, Department of Epidemiology and Community Health, School of Veterinary Medicine, 3110 Vet School, Baton Rouge, Louisiana 70803-8404; (504) 346-3335; Fax: (504) 346-3295
