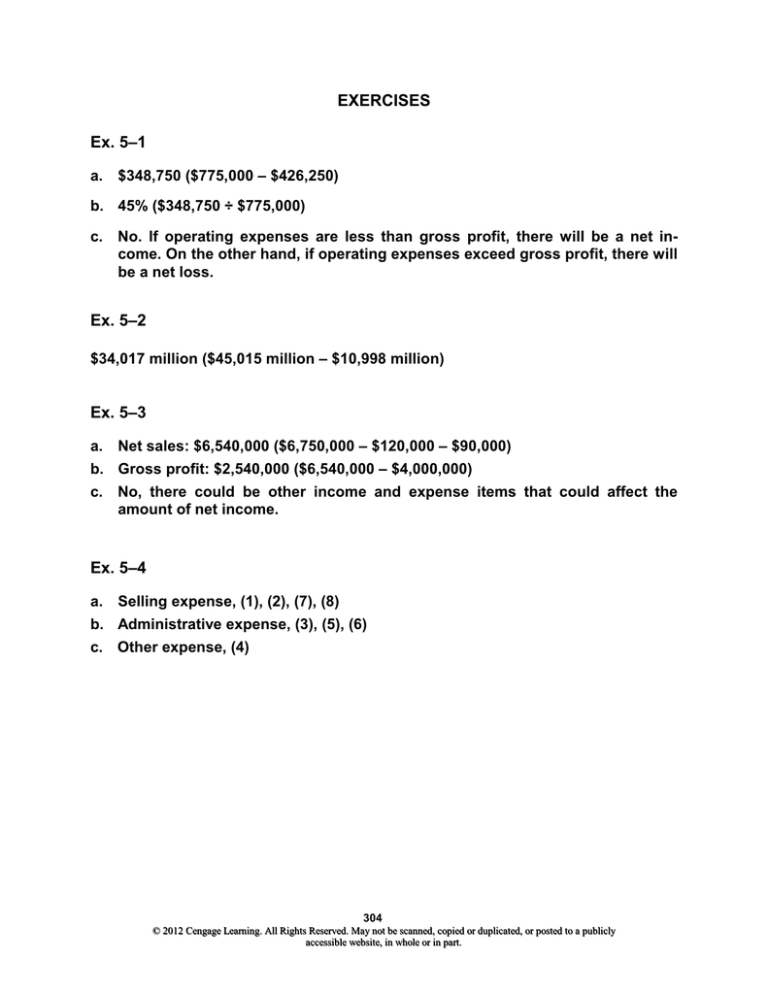
EXERCISES
Ex. 5–1
a. $348,750 ($775,000 – $426,250)
b. 45% ($348,750 ÷ $775,000)
c. No. If operating expenses are less than gross profit, there will be a net income. On the other hand, if operating expenses exceed gross profit, there will
be a net loss.
Ex. 5–2
$34,017 million ($45,015 million – $10,998 million)
Ex. 5–3
a. Net sales: $6,540,000 ($6,750,000 – $120,000 – $90,000)
b. Gross profit: $2,540,000 ($6,540,000 – $4,000,000)
c. No, there could be other income and expense items that could affect the
amount of net income.
Ex. 5–4
a. Selling expense, (1), (2), (7), (8)
b. Administrative expense, (3), (5), (6)
c. Other expense, (4)
304
© 2012 Cengage Learning. All Rights Reserved. May not be scanned, copied or duplicated, or posted to a publicly
accessible website, in whole or in part.
Ex. 5–5
HEARTLAND COMPANY
Income Statement
For the Year Ended November 30, 2012
Revenues:
Net sales ......................................................................
Rent revenue ...............................................................
Total revenues .........................................................
Expenses:
Cost of merchandise sold ..........................................
Selling expenses .........................................................
Administrative expenses ............................................
Interest expense ..........................................................
Total expenses ........................................................
Net income ..........................................................................
$4,200,000
95,000
$4,295,000
$2,500,000
400,000
300,000
20,000
3,220,000
$1,075,000
305
© 2012 Cengage Learning. All Rights Reserved. May not be scanned, copied or duplicated, or posted to a publicly
accessible website, in whole or in part.
Ex. 5–6
1. Sales returns and allowances and sales discounts should be deducted from
(not added to) sales.
2. Sales returns and allowances and sales discounts should be deducted from
sales to yield "net sales" (not gross sales).
3. Deducting the cost of merchandise sold from net sales yields gross profit.
4. Deducting the total expenses from gross profit would yield income from operations (or operating income).
5. Interest revenue should be reported under the caption “Other income” and
should be added to income from operations to arrive at net income.
6. The final amount on the income statement should be labeled net income, not
gross profit.
A correct income statement would be as follows:
KEEPSAKES COMPANY
Income Statement
For the Year Ended February 29, 2012
Revenue from sales:
Sales ...........................................................
Less: Sales returns and allowances ........
Sales discounts ...............................
Net sales ................................................
Cost of merchandise sold ..............................
Gross profit......................................................
Expenses:
Selling expenses ........................................
Administrative expenses ...........................
Delivery expense........................................
Total expenses .....................................
Income from operations .................................
Other income:
Interest revenue .........................................
Net income .......................................................
$7,200,000
$275,000
130,000
405,000
$6,795,000
4,075,000
$2,720,000
$ 950,000
475,000
125,000
1,550,000
$1,170,000
30,000
$1,200,000
306
© 2012 Cengage Learning. All Rights Reserved. May not be scanned, copied or duplicated, or posted to a publicly
accessible website, in whole or in part.
Ex. 5–7
a. $30,000 ($300,000 – $20,000 – $250,000)
b. $150,000 ($250,000 – $100,000)
c. $552,000 ($600,000 – $30,000 – $18,000)
d. $222,000 ($552,000 – $330,000)
e. $5,000 ($850,000 – $70,000 – $775,000)
f.
$475,000 ($775,000 – $300,000)
g. $550,000 ($515,000 + $10,000 + $25,000)
h. $515,000 ($400,000 + $115,000)
Ex. 5–8
a.
WARM PLACE FURNISHINGS COMPANY
Income Statement
For the Year Ended December 31, 2012
Revenue from sales:
Sales .........................................................
Less: Sales returns and allowances .....
Sales discounts ............................
Net sales...............................................
Cost of merchandise sold ...........................
Gross profit ..................................................
Expenses:
Selling expenses .....................................
Administrative expenses ........................
Total expenses ....................................
Income from operations ..............................
Other expense:
Interest expense ......................................
Net income ...................................................
$3,000,000
$160,000
40,000
200,000
$2,800,000
1,700,000
$1,100,000
$ 450,000
250,000
700,000
$ 400,000
30,000
$ 370,000
b. The major advantage of the multiple-step form of income statement is that relationships such as gross profit to sales are indicated. The major disadvantages are that it is more complex and the total revenues and expenses are not
indicated, as is the case in the single-step income statement.
307
© 2012 Cengage Learning. All Rights Reserved. May not be scanned, copied or duplicated, or posted to a publicly
accessible website, in whole or in part.
Ex. 5–9
Balance Sheet Accounts
Income Statement Accounts
100
400
Revenues
410 Sales
411 Sales Returns and
Allowances
412 Sales Discounts
500
Expenses
510 Cost of Merchandise Sold
520 Sales Salaries Expense
521 Advertising Expense
522 Depreciation Expense—
Store Equipment
523 Store Supplies Expense
524 Delivery Expense
529 Miscellaneous Selling
Expense
530 Office Salaries Expense
531 Rent Expense
532 Depreciation Expense—
Office Equipment
533 Insurance Expense
534 Office Supplies Expense
539 Miscellaneous Administrative Expense
600
Other Expense
610 Interest Expense
Assets
110 Cash
112 Accounts Receivable
114 Merchandise Inventory
115 Store Supplies
116 Office Supplies
117 Prepaid Insurance
120 Land
123 Store Equipment
124 Accumulated Depreciation—
Store Equipment
125 Office Equipment
126 Accumulated Depreciation—
Office Equipment
200
Liabilities
210 Accounts Payable
211 Salaries Payable
212 Notes Payable
300
Stockholders’ Equity
310 Capital Stock
311 Retained Earnings
312 Dividends
313 Income Summary
Note: The order and number of some of the accounts within subclassifications is
somewhat arbitrary, as in accounts 115–117, accounts 520–524, and accounts
530–534. For example, in a new business, the order of magnitude expense account balances often cannot be determined in advance. The magnitude may also
vary from period to period.
308
© 2012 Cengage Learning. All Rights Reserved. May not be scanned, copied or duplicated, or posted to a publicly
accessible website, in whole or in part.
Ex. 5–10
a.
b.
c.
d.
e.
Cash ..............................................................................
Sales ........................................................................
30,000
Cost of Merchandise Sold ...........................................
Merchandise Inventory ...........................................
18,000
Accounts Receivable ...................................................
Sales ........................................................................
120,000
Cost of Merchandise Sold ...........................................
Merchandise Inventory ...........................................
72,000
Cash ..............................................................................
Sales ........................................................................
100,000
Cost of Merchandise Sold ...........................................
Merchandise Inventory ...........................................
70,000
Cash ..............................................................................
Sales ........................................................................
45,000
Cost of Merchandise Sold ...........................................
Merchandise Inventory ...........................................
27,000
Credit Card Expense ....................................................
Cash .........................................................................
9,000
30,000
18,000
120,000
72,000
100,000
70,000
45,000
27,000
9,000
Ex. 5–11
It was acceptable to debit Sales for the $80,000. However, using Sales Returns
and Allowances assists management in monitoring the amount of returns so that
quick action can be taken if returns become excessive.
Accounts Receivable should also have been credited for $80,000. In addition,
Cost of Merchandise Sold should only have been credited for the cost of the merchandise sold, not the selling price. Merchandise Inventory should also have
been debited for the cost of the merchandise returned. The entries to correctly
record the returns would have been as follows:
Sales (or Sales Returns and Allowances) ..................
Accounts Receivable ..............................................
80,000
Merchandise Inventory ................................................
Cost of Merchandise Sold ......................................
48,000
80,000
309
© 2012 Cengage Learning. All Rights Reserved. May not be scanned, copied or duplicated, or posted to a publicly
accessible website, in whole or in part.
48,000
Ex. 5–12
a. $39,200 [$40,000 – ($40,000 × 2%)]
b. Sales Returns and Allowances ....................................
Sales Discounts .......................................................
Cash ..........................................................................
40,000
Merchandise Inventory..................................................
Cost of Merchandise Sold .......................................
24,000
800
39,200
24,000
Ex. 5–13
(1) Sold merchandise on account, $35,000.
(2) Recorded the cost of the merchandise sold and reduced the merchandise inventory account, $21,000.
(3) Accepted a return of merchandise and granted an allowance, $2,000.
(4) Updated the merchandise inventory account for the cost of the merchandise
returned, $1,200.
(5) Received the balance due within the discount period, $32,340. [Sale of
$35,000, less return of $2,000, less discount of $660 (2% × $33,000).]
Ex. 5–14
a. $18,000
b. $18,600
c. $360 ($18,000 × 2%)
d. $18,240 ($18,600 – $360)
Ex. 5–15
a. $8,910 [Purchase of $12,000, less return of $3,000, less discount of $90
[($12,000 – $3,000) × 1%)]
b. Merchandise Inventory
310
© 2012 Cengage Learning. All Rights Reserved. May not be scanned, copied or duplicated, or posted to a publicly
accessible website, in whole or in part.
Ex. 5–16
Offer F is lower than offer E. Details are as follows:
List price ......................................................................
Less discount ..............................................................
E
$30,000
300
$29,700
Freight ..........................................................................
$29,700
F
$29,500
590
$28,910
375
$29,285
Ex. 5–17
(1) Purchased merchandise on account at a cost of $15,000.
(2) Paid freight, $400.
(3) An allowance or return of merchandise was granted by the creditor, $3,000.
(4) Paid the balance due within the discount period: debited Accounts Payable,
$12,000, and credited Merchandise Inventory for the amount of the discount,
$240, and Cash, $11,760.
Ex. 5–18
a.
b.
c.
Merchandise Inventory ................................................
Accounts Payable ...................................................
36,000
Accounts Payable ........................................................
Merchandise Inventory ...........................................
4,000
Accounts Payable ........................................................
Cash .........................................................................
Merchandise Inventory ...........................................
32,000
36,000
4,000
311
© 2012 Cengage Learning. All Rights Reserved. May not be scanned, copied or duplicated, or posted to a publicly
accessible website, in whole or in part.
31,360
640
Ex. 5–19
a.
b.
c.
d.
e.
Merchandise Inventory ................................................
Accounts Payable—Sierra Co................................
60,000
Accounts Payable—Sierra Co. ....................................
Cash .........................................................................
Merchandise Inventory ...........................................
60,000
Accounts Payable*—Sierra Co....................................
Merchandise Inventory ...........................................
9,900
Merchandise Inventory ................................................
Accounts Payable—Sierra Co................................
7,500
Cash ..............................................................................
Accounts Payable—Sierra Co................................
2,400
60,000
59,400
600
9,900
7,500
2,400
*Note: The debit of $9,900 to Accounts Payable in entry (c) is the amount of cash
refund due from Sierra Co. It is computed as the amount that was paid for the returned merchandise, $10,000, less the purchase discount of $100 ($10,000 × 1%).
The credit to Accounts Payable of $7,500 in entry (d) reduces the debit balance in
the account to $2,400, which is the amount of the cash refund in entry (e). The alternative entries below yield the same final results.
c.
d.
e.
Accounts Receivable—Sierra Co. ...............................
Merchandise Inventory ...........................................
9,900
Merchandise Inventory ................................................
Accounts Payable—Sierra Co................................
7,500
Cash ..............................................................................
Accounts Payable—Sierra Co. ....................................
Accounts Receivable—Sierra Co. .........................
2,400
7,500
9,900
7,500
Ex. 5–20
a.
$35,000 ($36,000 – $1,000)
b. $8,999 [($10,000 – $1,200) – ($8,800 × 2%) + $375]
c.
$7,425 [($8,250 – $750) – ($7,500 × 1%)]
d. $3,630 [($4,000 – $500) – ($3,500 × 2%) + $200]
e.
$8,415 [$8,500 – ($8,500 × 1%)]
312
© 2012 Cengage Learning. All Rights Reserved. May not be scanned, copied or duplicated, or posted to a publicly
accessible website, in whole or in part.
9,900
Ex. 5–21
a. At the time of sale
b. $28,000
c. $29,960 [$28,000 + ($28,000 × 7%)]
d. Sales Tax Payable
Ex. 5–22
a.
b.
Accounts Receivable ...................................................
Sales ........................................................................
Sales Tax Payable ($12,900 × 4%) .........................
13,416
Cost of Merchandise Sold ...........................................
Merchandise Inventory ...........................................
7,800
Sales Tax Payable ........................................................
Cash .........................................................................
32,750
12,900
516
7,800
32,750
Ex. 5–23
a.
b.
c.
Accounts Receivable—Boyle Co. ..............................
Sales ........................................................................
45,000
Cost of Merchandise Sold ...........................................
Merchandise Inventory ...........................................
27,000
Sales Returns and Allowances ...................................
Accounts Receivable—Boyle Co. ..........................
9,000
Merchandise Inventory ................................................
Cost of Merchandise Sold ......................................
5,400
Cash ..............................................................................
Sales Discounts ...........................................................
Accounts Receivable—Boyle Co. ..........................
35,280
720
45,000
27,000
9,000
5,400
313
© 2012 Cengage Learning. All Rights Reserved. May not be scanned, copied or duplicated, or posted to a publicly
accessible website, in whole or in part.
36,000
Ex. 5–24
a.
b.
c.
Merchandise Inventory ................................................
Accounts Payable—Skycrest Co. .........................
45,000
Accounts Payable—Skycrest Co. ..............................
Merchandise Inventory ...........................................
9,000
Accounts Payable—Skycrest Co. ..............................
Cash .........................................................................
Merchandise Inventory ...........................................
36,000
45,000
9000
35,280
720
Ex. 5–25
a. debit
b. debit
c. debit
d. credit
e. debit
f.
debit
g. credit
Ex. 5–26
Cost of Merchandise Sold ...........................................
Merchandise Inventory ...........................................
Inventory shrinkage ($715,950 – $693,675).
22,275
Ex. 5–27
(b) Advertising Expense
(c) Cost of Merchandise Sold
(e) Sales
(f) Sales Discounts
(g) Sales Returns and Allowances
(i) Supplies Expense
Note: (j) Dividends is closed to Retained Earnings, not Income Summary.
314
© 2012 Cengage Learning. All Rights Reserved. May not be scanned, copied or duplicated, or posted to a publicly
accessible website, in whole or in part.
22,275
Ex. 5–28
2012
Dec. 31
31
31
31
Sales ....................................................................
Income Summary...........................................
3,000,000
Income Summary ................................................
Sales Discounts .............................................
Sales Returns and Allowances ....................
Cost of Merchandise Sold ............................
Selling Expenses ...........................................
Administrative Expenses ..............................
Interest Expense ............................................
2,630,000
Income Summary ................................................
Retained Earnings .........................................
370,000
Retained Earnings ..............................................
Dividends .......................................................
50,000
Sales ....................................................................
Income Summary...........................................
800,000
Income Summary ................................................
Administrative Expenses ..............................
Cost of Merchandise Sold ............................
Interest Expense ............................................
Sales Discounts .............................................
Sales Returns and Allowances ....................
Selling Expenses ...........................................
Store Supplies Expense ...............................
641,000
Income Summary ................................................
Retained Earnings .........................................
159,000
Retained Earnings ..............................................
Dividends .......................................................
5,000
3,000,000
40,000
160,000
1,700,000
450,000
250,000
30,000
370,000
50,000
Ex. 5–29
2012
Aug. 31
31
31
31
800,000
90,000
350,000
1,000
18,000
12,000
150,000
20,000
159,000
315
© 2012 Cengage Learning. All Rights Reserved. May not be scanned, copied or duplicated, or posted to a publicly
accessible website, in whole or in part.
5,000
Ex. 5–30
a. 2009: 1.67 {$71,288 ÷ [($41,164 + $44,324) ÷ 2]}
2008: 1.60 {$77,349 ÷ [($44,324 + $52,263) ÷ 2]}
b. These analyses indicate a slight increase in the effectiveness in the use of
the assets to generate profits. A comparison with similar companies or industry averages would be helpful in making a more definitive statement on the effectiveness of the use of the assets.
Note to Instructors: During 2006–2009, the U.S. economy slowed resulting in
a decrease in construction and building. This slowdown likely affected The
Home Depot’s sales and ratio of net sales to total assets.
Ex. 5–31
a. 3.34 {$76,000 ÷ [($23,211 + $22,299) ÷ 2]}
b. Although Kroger and Tiffany are both retail stores, Tiffany sells jewelry at a
much slower velocity than Kroger sells groceries. Thus, Kroger is able to
generate $3.34 of sales for every dollar of assets. Tiffany, however, is only
able to generate $0.95 in sales per dollar of assets. This difference is reasonable when one considers the sales rate for jewelry and the cost of holding
jewelry inventory, relative to groceries. Fortunately, Tiffany is able to offset its
slow sales velocity, relative to groceries, with higher gross profits, relative to
groceries.
Note to Instructors: For 2009, Kroger’s gross profit percentage (gross profit
divided by revenues) was 22.9%, while Tiffany’s gross profit percentage was
57.5%. Kroger’s ratio of operating income to revenues was 3.2%, while Tiffany’s ratio of operating income to revenues was 13.1%.
Appendix Ex. 5–32
a. Purchases discounts, purchases returns and allowances
b. Freight in
c. Merchandise available for sale
d. Merchandise inventory (ending)
316
© 2012 Cengage Learning. All Rights Reserved. May not be scanned, copied or duplicated, or posted to a publicly
accessible website, in whole or in part.

