ANOVA SPSS Example
advertisement

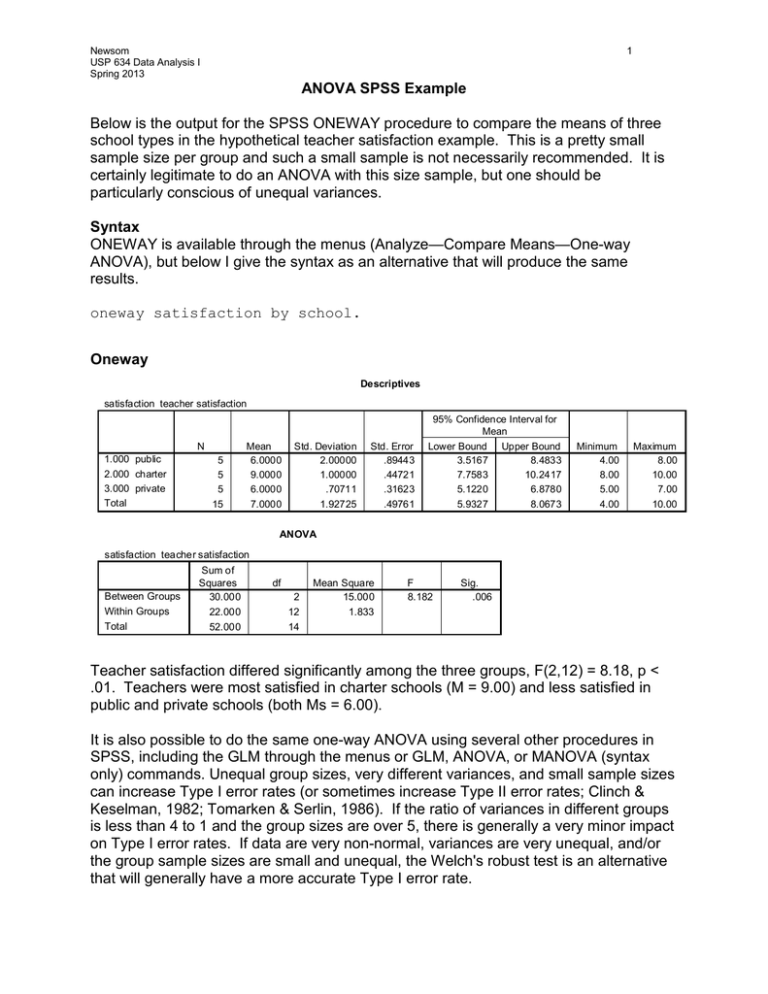
Newsom USP 634 Data Analysis I Spring 2013 1 ANOVA SPSS Example Below is the output for the SPSS ONEWAY procedure to compare the means of three school types in the hypothetical teacher satisfaction example. This is a pretty small sample size per group and such a small sample is not necessarily recommended. It is certainly legitimate to do an ANOVA with this size sample, but one should be particularly conscious of unequal variances. Syntax ONEWAY is available through the menus (Analyze—Compare Means—One-way ANOVA), but below I give the syntax as an alternative that will produce the same results. oneway satisfaction by school. Oneway Descriptives satisfaction teacher satisfaction N 1.000 public 2.000 charter 3.000 private Total 5 5 5 15 Mean 6.0000 9.0000 6.0000 7.0000 Std. Deviation 2.00000 1.00000 .70711 1.92725 Std. Error .89443 .44721 .31623 .49761 95% Confidence Interval for Mean Lower Bound Upper Bound 3.5167 8.4833 7.7583 10.2417 5.1220 6.8780 5.9327 8.0673 Minimum 4.00 8.00 5.00 4.00 Maximum 8.00 10.00 7.00 10.00 ANOVA satisfaction teacher satisfaction Between Groups Within Groups Total Sum of Squares 30.000 22.000 52.000 df 2 12 14 Mean Square 15.000 1.833 F 8.182 Sig. .006 Teacher satisfaction differed significantly among the three groups, F(2,12) = 8.18, p < .01. Teachers were most satisfied in charter schools (M = 9.00) and less satisfied in public and private schools (both Ms = 6.00). It is also possible to do the same one-way ANOVA using several other procedures in SPSS, including the GLM through the menus or GLM, ANOVA, or MANOVA (syntax only) commands. Unequal group sizes, very different variances, and small sample sizes can increase Type I error rates (or sometimes increase Type II error rates; Clinch & Keselman, 1982; Tomarken & Serlin, 1986). If the ratio of variances in different groups is less than 4 to 1 and the group sizes are over 5, there is generally a very minor impact on Type I error rates. If data are very non-normal, variances are very unequal, and/or the group sample sizes are small and unequal, the Welch's robust test is an alternative that will generally have a more accurate Type I error rate. Newsom USP 634 Data Analysis I Spring 2013 2 Post Hoc SPSS Example The results from the one-way ANOVA do not indicate which of the three groups differ from one another, so, in many cases, it is of interest to follow the analysis with a post hoc test or a planned comparison among particular means. If several comparisons between pairs of means are made, it is a good idea to use a test, such as the Tukey, that controls for alpha inflation. For the present example, there are not too many possible comparisons to make (just 3), so alpha inflation will not be a tremendous issue. Also, in the case of this artificial example, two of the means are exactly equal and should not require a statistical test. Nevertheless, to illustrate the use of the Tukey post hoc approach in SPSS. I’ve also included the Games-Howell test, because very small sample sizes may be particularly sensitive to the homogeneity of variance assumption. Syntax To obtain the post hoc tests with syntax, the POST HOC subcommand is added. oneway satisfaction by school /posthoc=tukey gh. Post Hoc Tests Multiple Comparisons Dependent Variable: satisfaction teacher satisfaction (I) school school type 1.000 public Tukey HSD 2.000 charter 3.000 private Games-Howell 1.000 public 2.000 charter 3.000 private (J) school school type 2.000 charter 3.000 private 1.000 public 3.000 private 1.000 public 2.000 charter 2.000 charter 3.000 private 1.000 public 3.000 private 1.000 public 2.000 charter Mean Difference (I-J) -3.00000* .00000 3.00000* 3.00000* .00000 -3.00000* -3.00000 .00000 3.00000 3.00000* .00000 -3.00000* Std. Error .85635 .85635 .85635 .85635 .85635 .85635 1.00000 .94868 1.00000 .54772 .94868 .54772 Sig. .011 1.000 .011 .011 1.000 .011 .056 1.000 .056 .002 1.000 .002 95% Confidence Interval Lower Bound Upper Bound -5.2846 -.7154 -2.2846 2.2846 .7154 5.2846 .7154 5.2846 2.2846 -2.2846 -5.2846 -.7154 -6.0861 .0861 -3.0903 3.0903 -.0861 6.0861 1.3978 4.6022 -3.0903 3.0903 -4.6022 -1.3978 *. The mean difference is significant at the .05 level. Homogeneous Subsets satisfaction teacher satisfaction Tukey HSDa school school type 1.000 public 3.000 private 2.000 charter Sig. N 5 5 5 Subset for alpha = .05 1 2 6.0000 6.0000 9.0000 1.000 1.000 Means for groups in homogeneous subsets are displayed. a. Uses Harmonic Mean Sample Size = 5.000. The Tukey post hoc tests indicated that teacher satisfaction in the charter schools differed significantly from teacher satisfaction in public and private schools (p < .05). The Games-Howell test, however, suggested that the difference between public and charter schools was only marginally significant (p = .056).


