The Value Premium Lives
advertisement

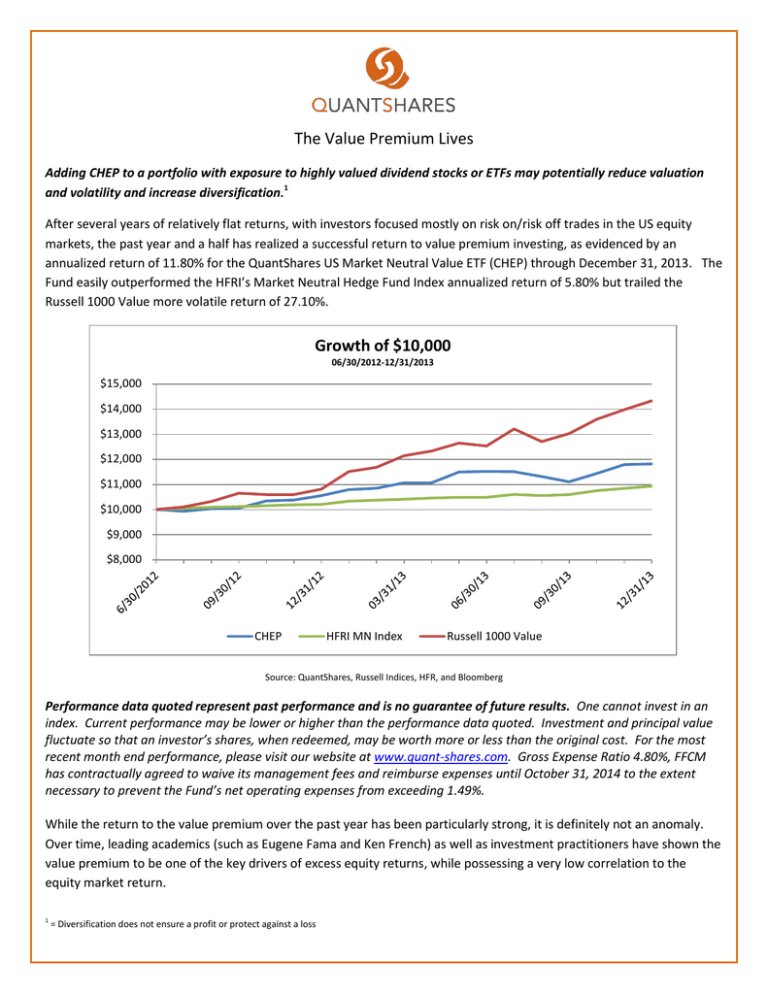
The Value Premium Lives Adding CHEP to a portfolio with exposure to highly valued dividend stocks or ETFs may potentially reduce valuation and volatility and increase diversification.1 After several years of relatively flat returns, with investors focused mostly on risk on/risk off trades in the US equity markets, the past year and a half has realized a successful return to value premium investing, as evidenced by an annualized return of 11.80% for the QuantShares US Market Neutral Value ETF (CHEP) through December 31, 2013. The Fund easily outperformed the HFRI’s Market Neutral Hedge Fund Index annualized return of 5.80% but trailed the Russell 1000 Value more volatile return of 27.10%. Growth of $10,000 06/30/2012-12/31/2013 $15,000 $14,000 $13,000 $12,000 $11,000 $10,000 $9,000 $8,000 CHEP HFRI MN Index Russell 1000 Value Source: QuantShares, Russell Indices, HFR, and Bloomberg Performance data quoted represent past performance and is no guarantee of future results. One cannot invest in an index. Current performance may be lower or higher than the performance data quoted. Investment and principal value fluctuate so that an investor’s shares, when redeemed, may be worth more or less than the original cost. For the most recent month end performance, please visit our website at www.quant-shares.com. Gross Expense Ratio 4.80%, FFCM has contractually agreed to waive its management fees and reimburse expenses until October 31, 2014 to the extent necessary to prevent the Fund’s net operating expenses from exceeding 1.49%. While the return to the value premium over the past year has been particularly strong, it is definitely not an anomaly. Over time, leading academics (such as Eugene Fama and Ken French) as well as investment practitioners have shown the value premium to be one of the key drivers of excess equity returns, while possessing a very low correlation to the equity market return. 1 = Diversification does not ensure a profit or protect against a loss The chart below shows how Fama and French’s* value premium has performed since 1926. Fama and French Value Premium* Correlation to Equity Risk Premium 0.22 5000 4000 3000 2000 1000 0 *Fama and French Value Premium is derived by calculating the Book to Market Value of each stock in the CRSP database. The book-to-market ratio is high for value stocks and low for growth stocks. Correlation of Value factor to equity risk premium is .22. Performance data quoted represent past performance and is no guarantee of future results. Source: http://mba.tuck.dartmouth.edu/pages/faculty/ken.french/data_library.html#BookEquity QuantShares Market Neutral Value Fund (CHEP) Fama and French’s method for calculating value is based on a single metric, book to market, and uses a very large un-investable universe. Conversely, CHEP employs a diverse look at valuation, targeting cheap and expensive stocks within sectors and limiting the universe to the largest 1000 stocks in the United States. Value in CHEP is determined by an equal weighted combination of book to price, cash flow to price, and forward earnings to price of each security. Stocks are ranked by their overall value score, with the 20% cheapest names in each sector bought as equally weighted long positions and the 20% most expensive names in each sector sold as equally weighted short positions. This process is systematic, as the Fund rebalances at the end of each month so that it consistently owns the least expensive stocks and goes short the most expensive ones. Both the market and sector neutrality of the Fund’s portfolio construction make CHEP a valuable asset for diversification purposes. CHEP has a beta of 0.44 versus the Russell 1000 Value (based on weekly data since inception 09/13/2011) and 0.92 versus the HFRI Market Neutral Index (based on monthly data since inception 09/2011). CHEP’s volatility is less than half of the Russell 1000 Value (6.61% and 14.83%, respectively using weekly data since inception 09/13/2011), and close to the market neutral proxy, HFRI Market Neutral Index of 2.83%, (based on monthly data since inception 09/2011). CHEP has a long weighted average Price to Earnings ratio of 12.43 and a short weighted average Price to Earnings ratio of 33.97 as of 12/31/2013. Adding CHEP to a portfolio with exposure to highly valued dividend stocks or ETFs may potentially reduce valuation and volatility 1 and increase diversification. The run up in prices over the past year has stretched valuations of a number of different types of equities, especially dividend paying securities. Adding CHEP to a portfolio heavily invested in dividend paying stocks or ETFs can help bring down the overall valuation of 1 the portfolio and add diversification by adding an asset that has exhibited historically low correlation and beta to the equity markets. For more information on how CHEP can be used to diversify a portfolio, or any other questions on QuantShares ETFs, please call Kevin Collins at 617-292-9801. QuantShares ETF Performance 1 Year Since Inception Month End 12/31/2013 CHEP CHEP NAV MP 12.02% 12.06% 6.74% 6.76% Quarter End 12/31/2013 CHEP CHEP NAV MP 12.02% 12.06% 6.74% 6.76% Inception 09/13/2011 Before investing you should carefully consider the Fund’s investment objectives, risks, charges, and expenses. This and other information is in the Fund’s prospectus which can be obtained at www.quant-shares.com. Please read the prospectus carefully before you invest. Foreside Fund Services, LLC, Distributor Shares are not individually redeemable and can be redeemed only in Creation Units. The market price of shares can be at, below or above the NAV. Market Price returns are based upon the midpoint of the bid/ask spread at 4:00PM Eastern time (when NAV is normally determined), and do not represent the returns you would receive if you traded shares at other times. Fund returns assume that dividends and capital gains distributions have been reinvested in the Fund at NAV. Some performance results reflect expense subsidies and waivers in effect during certain periods. Absent these waivers, results would have been less favorable. Risks: There is no guarantee that the funds will reach their objective. Investing involves risk, including possible loss of principal. There is a risk that during a “bull” market, when most equity securities and long only ETFs are increasing in value, the Funds’ short positions will likely cause the Fund to underperform the overall U.S. equity market and such ETFs. There may be periods when the value style is out of favor, and during which the investment performance of a fund using a value strategy may suffer. These securities may be more volatile than a broad cross-section of securities, and momentum may be an indicator that a security’s price is peaking. The Funds may not be suitable for all investors. Short selling could cause unlimited losses, derivatives could result in losses beyond the amount invested, and the value of an investment in the Fund may fall sharply. HFRI Equity Market Neutral Index: Incorporates equity market neutral strategies including both Factor-based and Statistical Arbitrage/Trading Strategies. Equity Market Neutral Strategies typically maintain characteristic net equity market exposure no greater than 10% long or short. S&P 500 is an index of 500 large cap common stocks actively traded on the NYSE and NASDAQ. One cannot invest directly in an index. Sharpe Ratio: The measure of the risk-adjusted return of an investment. Standard Deviation: indicates the volatility of a fund’s total return. In general, the higher the standard deviation, the greater the volatility of return. Correlation: A statistical measure of how two securities move in relation to each other. Ranges between -1 and +1, positive correlation implies that as one security moves, either up or down, the other security will move in the same direction. Negative correlation implies that if one security moves in either direction, up or down, the other security will move in the opposite direction.


