Capitalization Rate Virginia Land Class Index (Orchards)
advertisement
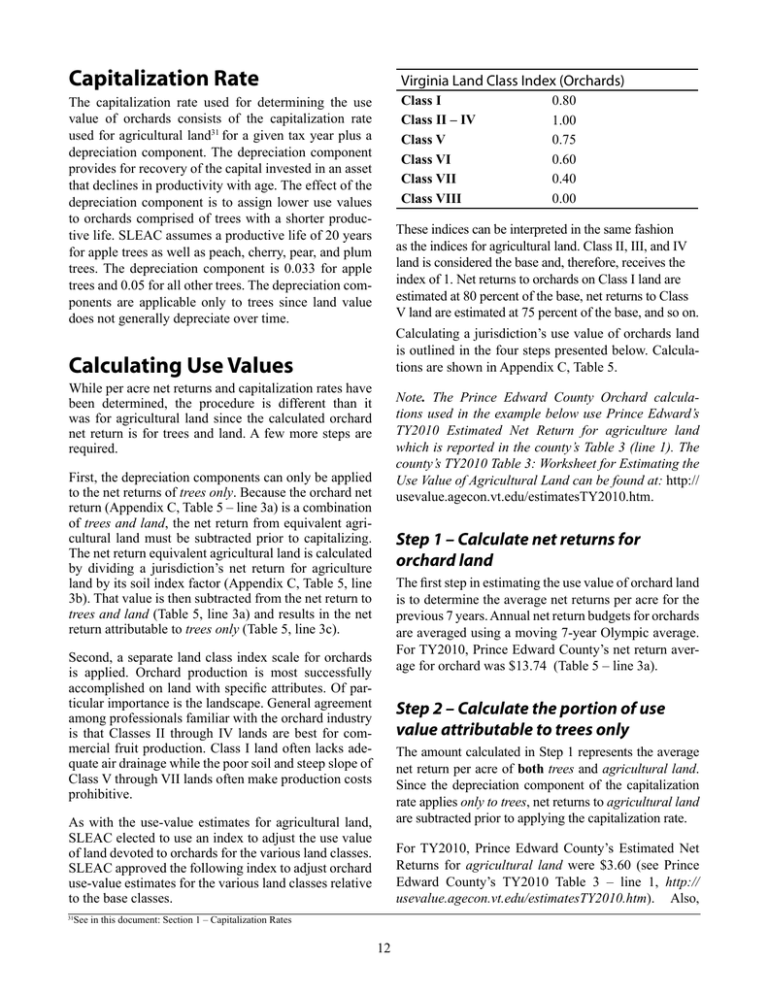
Capitalization Rate Virginia Land Class Index (Orchards) Class I Class II – IV Class V Class VI Class VII Class VIII The capitalization rate used for determining the use value of orchards consists of the capitalization rate used for agricultural land31 for a given tax year plus a depreciation component. The depreciation component provides for recovery of the capital invested in an asset that declines in productivity with age. The effect of the depreciation component is to assign lower use values to orchards comprised of trees with a shorter productive life. SLEAC assumes a productive life of 20 years for apple trees as well as peach, cherry, pear, and plum trees. The depreciation component is 0.033 for apple trees and 0.05 for all other trees. The depreciation components are applicable only to trees since land value does not generally depreciate over time. 0.80 1.00 0.75 0.60 0.40 0.00 These indices can be interpreted in the same fashion as the indices for agricultural land. Class II, III, and IV land is considered the base and, therefore, receives the index of 1. Net returns to orchards on Class I land are estimated at 80 percent of the base, net returns to Class V land are estimated at 75 percent of the base, and so on. Calculating a jurisdiction’s use value of orchards land is outlined in the four steps presented below. Calculations are shown in Appendix C, Table 5. Calculating Use Values While per acre net returns and capitalization rates have been determined, the procedure is different than it was for agricultural land since the calculated orchard net return is for trees and land. A few more steps are required. Note. The Prince Edward County Orchard calculations used in the example below use Prince Edward’s TY2010 Estimated Net Return for agriculture land which is reported in the county’s Table 3 (line 1). The county’s TY2010 Table 3: Worksheet for Estimating the Use Value of Agricultural Land can be found at: http:// usevalue.agecon.vt.edu/estimatesTY2010.htm. First, the depreciation components can only be applied to the net returns of trees only. Because the orchard net return (Appendix C, Table 5 – line 3a) is a combination of trees and land, the net return from equivalent agricultural land must be subtracted prior to capitalizing. The net return equivalent agricultural land is calculated by dividing a jurisdiction’s net return for agriculture land by its soil index factor (Appendix C, Table 5, line 3b). That value is then subtracted from the net return to trees and land (Table 5, line 3a) and results in the net return attributable to trees only (Table 5, line 3c). Step 1 – Calculate net returns for orchard land The first step in estimating the use value of orchard land is to determine the average net returns per acre for the previous 7 years. Annual net return budgets for orchards are averaged using a moving 7-year Olympic average. For TY2010, Prince Edward County’s net return average for orchard was $13.74 (Table 5 – line 3a). Second, a separate land class index scale for orchards is applied. Orchard production is most successfully accomplished on land with specific attributes. Of particular importance is the landscape. General agreement among professionals familiar with the orchard industry is that Classes II through IV lands are best for commercial fruit production. Class I land often lacks adequate air drainage while the poor soil and steep slope of Class V through VII lands often make production costs prohibitive. Step 2 – Calculate the portion of use value attributable to trees only The amount calculated in Step 1 represents the average net return per acre of both trees and agricultural land. Since the depreciation component of the capitalization rate applies only to trees, net returns to agricultural land are subtracted prior to applying the capitalization rate. As with the use-value estimates for agricultural land, SLEAC elected to use an index to adjust the use value of land devoted to orchards for the various land classes. SLEAC approved the following index to adjust orchard use-value estimates for the various land classes relative to the base classes. For TY2010, Prince Edward County’s Estimated Net Returns for agricultural land were $3.60 (see Prince Edward County’s TY2010 Table 3 – line 1, http:// usevalue.agecon.vt.edu/estimatesTY2010.htm). Also, See in this document: Section 1 – Capitalization Rates 31 12 see that its soil index factor was 1.149. Dividing the county’s Estimated Net Return by its soil index factor, results in a Net Return for only agricultural land of $3.13. Subtracting $3.13 from the orchard net return of $13.74 yields the portion of net return attributable to trees only which is a net gain of $10.61 (Appendix C, Table 5 – line 3c). Step 4 – Add the appropriate agricultural land use-value estimate Each jurisdiction uses two capitalization rates - one for apple trees and another for other trees. Each rate is the sum of the state’s annual moving straight 10-year average of the long-term interest rates and the jurisdiction’s moving straight 10-year average of its effective property tax rate (published annually by the Virginia Department of Taxation) plus a depreciation rate. As stated, for TY2010 in the Prince Edward County the apple tree estimates (Land Classes II, III, and IV) each show a net gain of $95.58 (Appendix C, Table 5 – Section 5). This value is multiplied by the corresponding Orchard Index (second column) to calculate for the remaining land class estimates for apple trees. The total use value of Apple Orchard real estate for a jurisdiction is calculated by combining the jurisdiction’s usevalue estimate attributable to apple trees and its use-value estimate attributable to agricultural land (without risk). For apple trees and land estimates, each apple tree value for Class I thru VIII is added to the corresponding Land Class use-value estimate for agriculture land (withoutrisk) (see Prince Edward County TY2010 Table 3 – Section 5, http://usevalue.agecon.vt.edu/estimatesTY2010. htm). Summing the two for each land class provides the apple trees and land estimate of $136.98 (Land Class I, $ 76.46 + $60.52); $150.05 (Land Class II, $95.58 + $54.47); $135.92 (Land Class III, $95.58 + $40.35) and so on (Appendix C, Table 5 - Section 5). For TY2010, Prince Edward County’s average longterm interest rate was 0.0734 and its average effective property tax rate was 0.0043 (Appendix C, Table 5 – lines 4a and 4b), summing the two results in a capitalization rate of 0.0777. Then, separate depreciation rates for apple trees and other trees are added. For apple trees, 0.0333 is added and 0.05 added for other trees, resulting in final capitalization rates of 0.1110 for Apple Orchard and 0.1277 for Other Orchard (Appendix C, Table 5 – lines 4e and 4f). Finally, for Apple Orchard each apple trees and land estimate is rounded to the nearest $10, resulting in usevalue estimates of $140 (Land Class I); $150 (Land Class II); $140 (Land Class III) and so on, which is the use-value estimate reported (Appendix B, Table 1b Prince Edward County – Apple). The same process is used in generating use-value estimates for each of the remaining capability classes. Step 3 – Multiply by the appropriate index number Dividing the net return calculated for trees only (Appendix C, Table 5 - line 3c) by the Apple Orchard and Other Orchard capitalization rates (Appendix C, Table 5 - lines 4e and 4f, respectively) results in apple trees and other trees estimates for Class II, III, and IV land. The remaining estimates (Class I and V-VIII) are calculated by multiplying the Class II – IV estimate (which are all the same) by a corresponding Orchard Index (Appendix C, Table 5 - Section 5). The total use value of Other Orchard real estate for a jurisdiction is calculated the same way as is Apple Orchard except that use-value estimates attributable to Other Trees are used. References For TY2010, in Prince Edward County, the net return attributable to trees only is a net gain of $10.61 (Appendix C, Table 5 – line 3c). Dividing this amount by the capitalization rates for Apple Orchard and Other Orchard (0.1110 and 0.1277) results in the reported use values for apple trees and other trees (TY2010 Table 5 - Section 5). The estimates for apple trees and other trees are shown as net gains for Land Classes II, III, and IV ($95.58 and $83.07). Multiplying these amounts by the corresponding orchard index for the remaining land classes results in the county’s estimates for apple trees and other trees (Appendix C, Table 5 – Section 5). Collins, M. and K.J. Moore. 1995. Post-harvesting processing of forages. Forages - the Science of Grassland Agriculture. Vol. II. (ed.) R.F. Barnes, D.A. Miller, and C.J. Nelson. Iowa State Univ. Press, Ames, Iowa. Moore, L.A. 1962. Grass-legume silage. Forages - the science of grassland agriculture. H.D. Hughes, M.E. Heath, D.S. Metcalfe (ed.). Second Edition. The Iowa State Univ. Press. Ames, Iowa. Smith, D. 1981. Forage management in the North. Kendal Hunt Publishing Co. Dubuque, Iowa. 13

