AGSC 320 Statistical Methods Numerical descriptive measures Data representation
advertisement

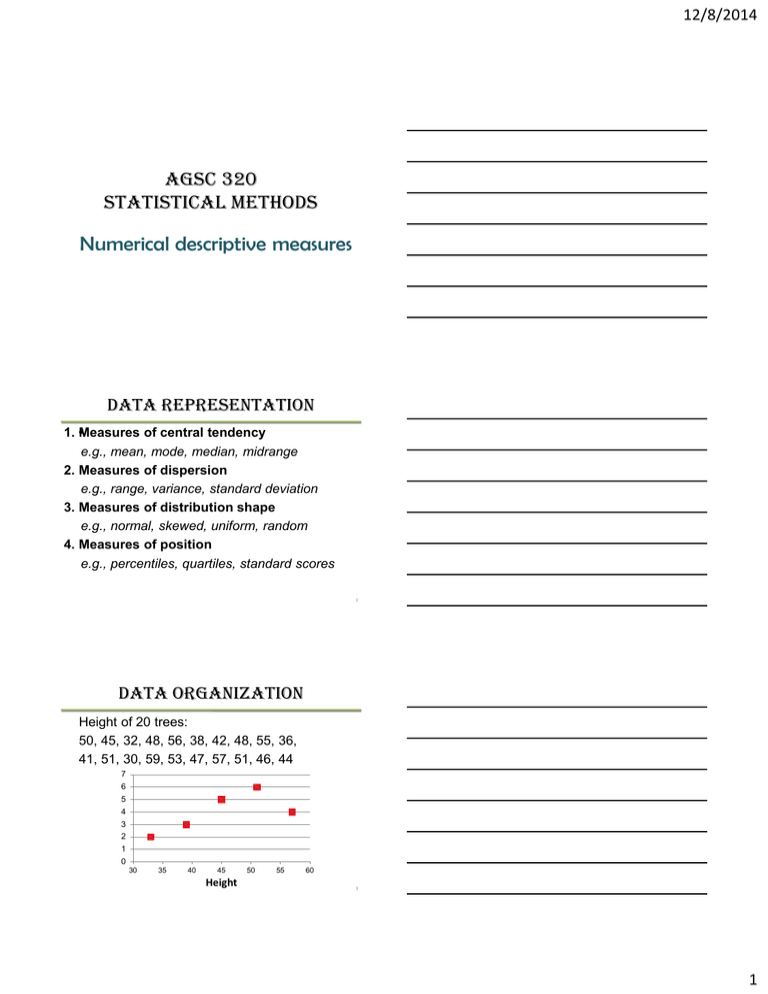
12/8/2014 AGSC 320 Statistical Methods Numerical descriptive measures Data representation 1. • Measures of central tendency e.g., mean, mode, median, midrange 2. Measures of dispersion e.g., range, variance, standard deviation 3. Measures of distribution shape e.g., normal, skewed, uniform, random 4. Measures of position e.g., percentiles, quartiles, standard scores 2 Data organization Height of 20 trees: 50, 45, 32, 48, 56, 38, 42, 48, 55, 36, 41, 51, 30, 59, 53, 47, 57, 51, 46, 44 7 6 5 4 3 2 1 0 30 35 40 45 Height 50 55 60 3 1 12/8/2014 Measures of central tendency 1. mean or arithmetic average Definition: sum of values divided by the total number of observations 4 Measures of central tendency 2. Median: Definition: the midpoint / middle value in a group of data The point that separate the data in two set with the same number of observations Steps: • arrange the data in order • find the midpoint 5 Measures of central tendency 3. Mode Definition: the most frequently occurring value / observation Notes: • not always unique • can also be bimodal, multimodal 4. Midrange Definition: sum of the lowest and highest values divided by 2 6 2 12/8/2014 Measures of central tendency Summary Statistics Mean Value 7 Relationship among mean,median,mode • Depending on the shape of the histogram / frequency distribution the mean can be located differently in respect with median or mode Mean=Median=Mode Mode<Median<Mean Mean<Median<Mode 8 Measures of dispersion 1. Range: Definition: the difference between the largest and smallest observation Range = xmax - xmin where xmax – largest observation xmin – smallest observation 9 3 12/8/2014 Measures of dispersion 2. Variance: • Definition: sum of the squared differences between each observation and the mean, divided by the number of observations. Population Sample 10 Measures of dispersion Working formulas for Variance and Standard deviation 11 Measures of dispersion 3. Standard deviation Definition: the square root of the variance • A measure of the spread of the observations in the original units Population Sample 12 4 12/8/2014 Measures of dispersion Variance and Standard deviation Using definition: Using working formulas: 13 Measures of dispersion Range rule of thumb A rough estimate of the standard deviation is a quarter of range s range 4 Example using tree data s ....... ........... ....... 14 Measures of dispersion 4. Coefficient of variation Ratio between standard deviation and mean sample CV s 100 x population CV 100 Example using tree data CV ....... 100 ........... [%] ....... 15 5 12/8/2014 Measures of central tendency grouped data Mean or Arithmetic average Definition: sum of values divided by the total number of observations c sample data x f j 1 c c j f j 1 xj Population data f j j 1 c f j j 1 j j x j , value of the j class midpo int th c number of classes f j frequency of the j th class 16 Measures of dispersion grouped data Variance and Standard deviation for frequency distribution c c sample data s2 f j 1 j ( x j x )2 population data c f j 1 j 2 f j 1 1 j ( j )2 c f j 1 j x j , value of the j th class midpo int c number of classes f j frequency of the j th class 17 Measures of dispersion grouped data Example: Daily commuting times, in minutes Calculate mean, variance, standard deviation, CV Daily commuting time Number of employees Less than 10 min 4 10 – 20 min 9 20 – 30 min 6 30 – 40 min 4 40 – 50 min 2 18 6 12/8/2014 Measures of dispersion grouped data • Remember: in a class all individuals are assumed to have the mid-value of the respective class • Mid-value of the class = class mean Commuting time < 10 min 10 – 20 min 20 – 30 min 30 – 40 min 40 – 50 min Total # employees 4 9 6 4 2 Class mean 5 fj x μj 20 19 Measures of dispersion grouped data • Mean commuting time: • Variance: c 2 f j 1 j ( j )2 c f j 1 4(5 ....) 2 9(15 ...) 2 .... (4 9 6 4 2) j • Standard deviation: σ=…… • Coefficient of variation: CV=σ/μ x100= ……/…….= 20 Use of standard deviation • Connect mean with standard deviation • Chebyshev’s Theorem: For any k>1, at least 1-1/k2 of the data lie within k standard deviation from the mean • Example: if k=2 →1-1/k2=1-1/4=0.75 or 75% This means that 75% of data values are within two standard deviation from the mean 21 7 12/8/2014 Measures of Distribution Shape • Skeweness: a measure of the asymmetry of the frequency distribution n ( xi x )3 /( n 1) i 1 3/ 2 n 2 ( xi x ) /( n 1) i 1 • Kurtosis: measure of the "peakeness" of the frequency distribution n ( xi x ) 4 /( n 1) 3 2 n 2 ( xi x ) /( n 1) i 1 i 1 22 Measure of position • Locate the relative position of an observation /data within dataset PERCENTILES – divide the data set into 100 groups with equal number of observations • indicate the position of an individual in a group – Education – Health related industry – Life sciences percentile (# observations less than x) 0.5 100 total # observations [%] 23 Percentiles charts 24 8 12/8/2014 Standard scores • Compare the relative position of observations within their defining dataset • Standard score or z-score z observation' s value mean x x standard deviation s • Allows comparison of different datasets or different type of data 25 Standard score Example: Student received 92% Statistics and 75% English Was the overall student’s performance bad? Additional info: • Mean grade for Statistics was 85 and for English was 70 • Variance for Statistics was 36 and for English was 9. Compute the z-scores: zStatistics x x ................ ............ s zEnglish x x ................ ............ s Conclusion: 26 Population vs. statistics • Various numerical measures can be computed for the population as well as for a sample – Mean , median, variance, coefficient of variation • When the measure is computed for the entire population then the measure is called population parameter or simply PARAMATER • When the measure is computed for a portion of the population (namely sample), then the measure is called sample statistics, or simply STATISTIC. 27 9


