Math 1: NASCAR Racing Day 2 9/3/14 Name: 6) The Olympic record
advertisement
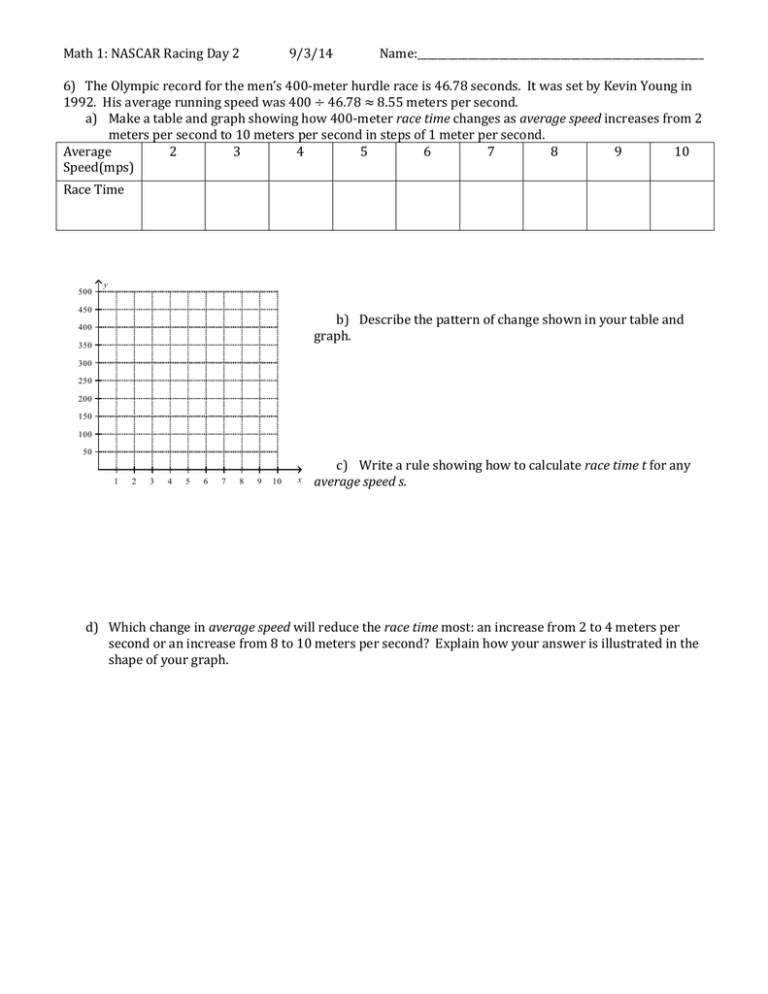
Math 1: NASCAR Racing Day 2 9/3/14 Name:________________________________________________________ 6) The Olympic record for the men’s 400-meter hurdle race is 46.78 seconds. It was set by Kevin Young in 1992. His average running speed was 400 ÷ 46.78 ≈ 8.55 meters per second. a) Make a table and graph showing how 400-meter race time changes as average speed increases from 2 meters per second to 10 meters per second in steps of 1 meter per second. Average 2 3 4 5 6 7 8 9 10 Speed(mps) Race Time 500 y 450 b) Describe the pattern of change shown in your table and graph. 400 350 300 250 200 150 100 50 1 2 3 4 5 6 7 8 9 10 x c) Write a rule showing how to calculate race time t for any average speed s. d) Which change in average speed will reduce the race time most: an increase from 2 to 4 meters per second or an increase from 8 to 10 meters per second? Explain how your answer is illustrated in the shape of your graph. 7) The Olympic record in the women’s 100-meter freestyle swim race is 53.52 seconds. It was set by Australian Jodie Henry in 2004. She swam at an average speed of 100 ÷ 53.52 ≈ 1.87 meters per second. a) Make a table and a graph showing the way average speed for the 100-meter race changes as time increases from 40 seconds to 120 seconds (2 minutes) in steps of 10 seconds. Time 40 50 60 70 80 90 100 110 120 Average Speed 5 y 4.5 4 b) Describe the pattern of change shown in your table and graph. 3.5 3 2.5 2 1.5 1 0.5 10 20 30 40 50 60 70 80 90 100 x c) Write a rule showing how to calculate average speed s for any race time t. d) Which change in race time will cause the greatest change in average speed: an increase from 50 to 60 seconds or an increase from 110 to 120 seconds? Explain how your answer is illustrated in the shape of your graph.

