Pearson's correlation
advertisement
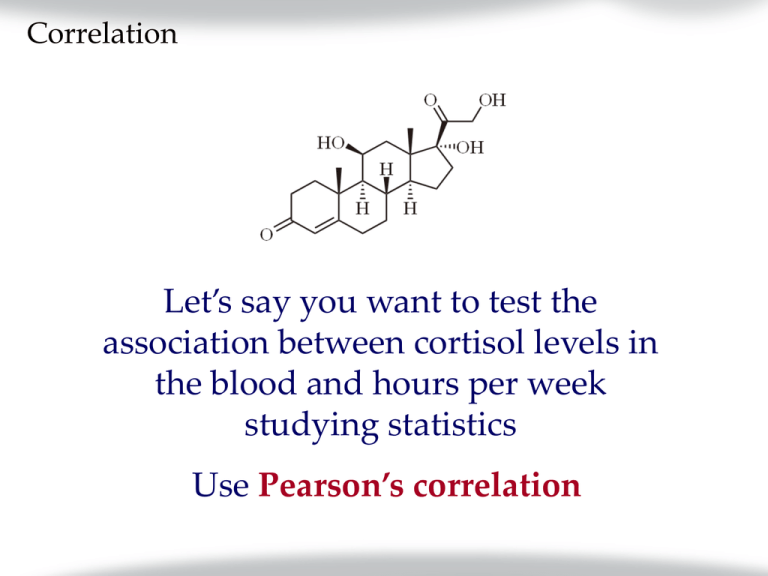
Correlation Let’s say you want to test the association between cortisol levels in the blood and hours per week studying statistics Use Pearson’s correlation Pearson correlation coefficient Used to test for linear associations between two continuous, (normally distributed) variables Unitless Values range from – 1 to + 1 0 indicates no linear correlation + 1 indicates perfect positive linear correlation – 1 indicates perfect negative linear correlation Negative association Stronger -1 Positive association Weaker Weaker 0 No association: Value under H0 Stronger +1 Same line, difference correlation r = 0.985 r = 0.667 How Pearson correlation works 1. 2. 3. Establish alpha (say, 0.05). Start with a null hypothesis. H0: There is no linear association between cortisol levels and time spent in the wards. ρxy = 0 3. Compute a test statistic, called Pearson’s r. Final steps for Pearson correlation 4. Compare rxy to a known distribution of Pearson correlation coefficients to obtain a p-value. 5. Make a decision about rejecting H0. As usual, if p > α, we do not reject H0; if p < α, we reject H0. Source: http://www.radford.edu/~jaspelme/statsbook/Chapter%20files/Table_of_Critical_Values_for_r.pdf Stressed medical students example Establish alpha: α = 0.05. Write your null hypothesis: 2. - 3. There is no association between average number of hours per week spent at the wards and cortisol levels. (ρxy = 0) Compute rxy, the test statistic. rxy = 0.736 22 8AM cortisol level (mcg/dL) 1. 20 18 16 14 12 45 50 55 60 65 Average hours per week in wards 70 75 Last steps 4. Compare rxy to a known distribution of r. (degrees of freedom = n – 2) rxy = 0.736 5. Make a decision about H0: Since p > α, we do not reject H0. Correlation coefficient interpretations rxy rxy =1 =-1 ≈ 0.8 ≈ - 0.8 ≈ 0.5 ≈ - 0.5 ≈0 ≈ - 0.2 Caveat #1: Slope of the line The slope of the best-fit line does not dictate the strength of the association Only the relative distance of the data points from the best-fit determines the association rxy = 1 for all Caveat #2: Must be a linear association Pearson’s r measures the strength of the linear association between two continuous variables Some variables may be related to each other, but not linearly rxy = 0 for all Some associations may be positive or negative, but not linearly related Caveat #3: Outliers Outliers often distort the linear association rxy = 0.80 rxy = 0.88 rxy = 0.54

