Notes - math AHS
advertisement

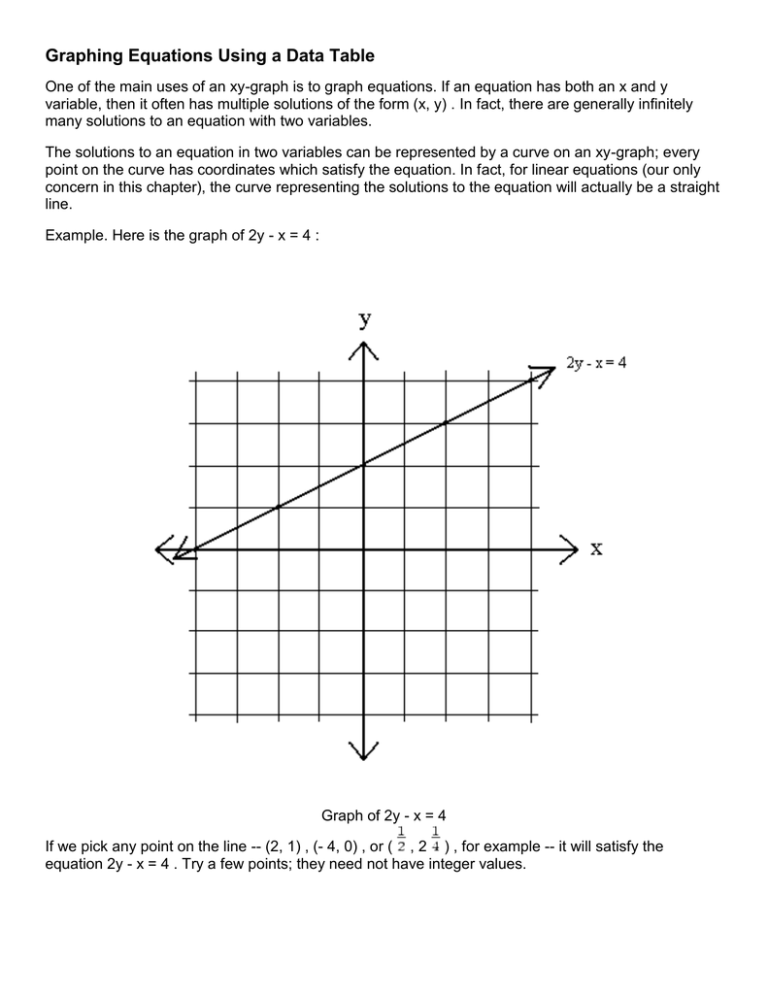
Graphing Equations Using a Data Table One of the main uses of an xy-graph is to graph equations. If an equation has both an x and y variable, then it often has multiple solutions of the form (x, y) . In fact, there are generally infinitely many solutions to an equation with two variables. The solutions to an equation in two variables can be represented by a curve on an xy-graph; every point on the curve has coordinates which satisfy the equation. In fact, for linear equations (our only concern in this chapter), the curve representing the solutions to the equation will actually be a straight line. Example. Here is the graph of 2y - x = 4 : Graph of 2y - x = 4 If we pick any point on the line -- (2, 1) , (- 4, 0) , or ( , 2 ) , for example -- it will satisfy the equation 2y - x = 4 . Try a few points; they need not have integer values. Making Data Tables One way to graph an equation is by use of a data table. A data table is a list of x -values and their corresponding y -values. To make a data table, draw two columns. Label one column x and the other column y . Then list the x -values -2, - 1, 0, 1, 2 in the x column: Data Table -- Step 1 Next, plug each value of x into the equation and solve for y . Insert these values of y into the table, under their corresponding x values. For this example, we will use the equation 2x - 4 = 3y : x = - 2 : 2(- 2) - 4 = 3y . 3y = - 8 . y = - 2 x = - 1 : 2(- 1) - 4 = 3y . 3y = - 6 . y = - 2 x = 0 : 2(0) - 4 = 3y . 3y = - 4 . y = - 1 x = 1 : 2(1) - 4 = 3y . 3y = - 2 . y = x = 2 : 2(2) - 4 = 3y . 3y = 0 . y = 0 Thus, the data table looks like: Data Table -- Step 2 Making Graphs Using Data Tables To make a graph using the data table, simply plot all the points and connect them with a straight line. Extend the line on both sides and add arrows. This is to show that the line continues infinitely, even after it can be seen on the graph. Here is our sample data table as a graph: Graph of 2x - 4 = 3y Note that the large dots on the line are unnecessary -- they are merely there to show the data points we plotted. To check, pick a data point that is on the line but not in the chart -- it should satisfy the equation. Notice also that it is not necessary to make a huge data table to graph a linear equation effectively. There is only one line through any two points, so already if one plots three points from a data table the redundancy of the third point acts as a check of the calculations. Of course, for more general equations whose graph does not consist of a straight line, more points are necessary to get an idea of the appearance of the graph.


