8-24-2015 Core Math 2
advertisement
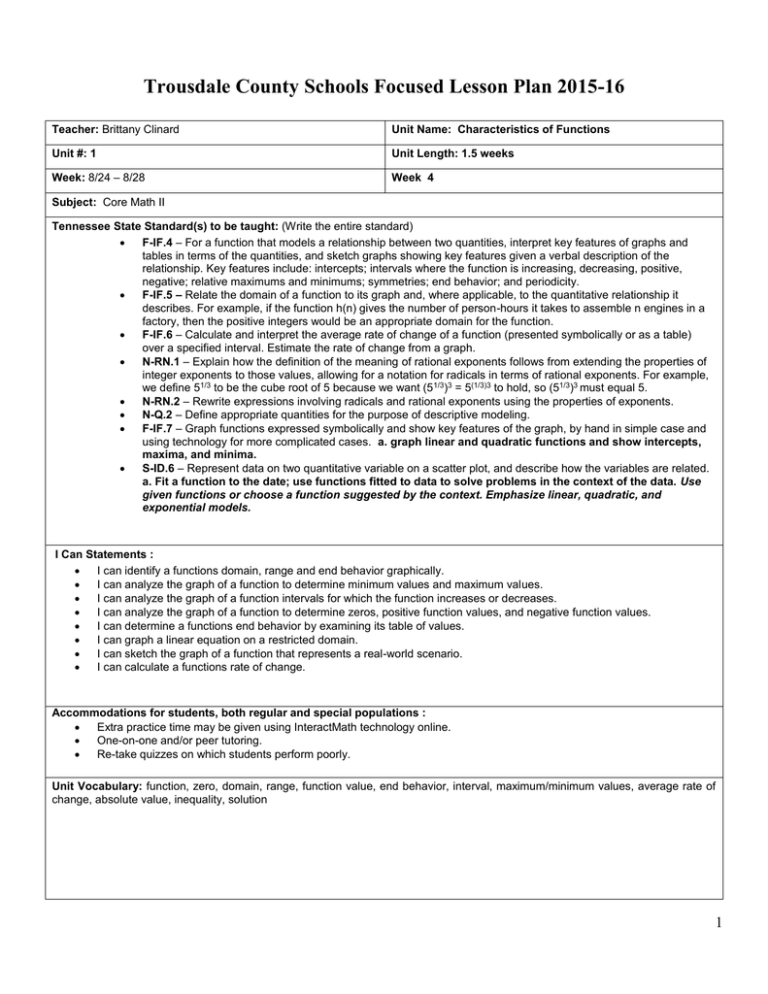
Trousdale County Schools Focused Lesson Plan 2015-16 Teacher: Brittany Clinard Unit Name: Characteristics of Functions Unit #: 1 Unit Length: 1.5 weeks Week: 8/24 – 8/28 Week 4 Subject: Core Math II Tennessee State Standard(s) to be taught: (Write the entire standard) F-IF.4 – For a function that models a relationship between two quantities, interpret key features of graphs and tables in terms of the quantities, and sketch graphs showing key features given a verbal description of the relationship. Key features include: intercepts; intervals where the function is increasing, decreasing, positive, negative; relative maximums and minimums; symmetries; end behavior; and periodicity. F-IF.5 – Relate the domain of a function to its graph and, where applicable, to the quantitative relationship it describes. For example, if the function h(n) gives the number of person-hours it takes to assemble n engines in a factory, then the positive integers would be an appropriate domain for the function. F-IF.6 – Calculate and interpret the average rate of change of a function (presented symbolically or as a table) over a specified interval. Estimate the rate of change from a graph. N-RN.1 – Explain how the definition of the meaning of rational exponents follows from extending the properties of integer exponents to those values, allowing for a notation for radicals in terms of rational exponents. For example, we define 51/3 to be the cube root of 5 because we want (51/3)3 = 5(1/3)3 to hold, so (51/3)3 must equal 5. N-RN.2 – Rewrite expressions involving radicals and rational exponents using the properties of exponents. N-Q.2 – Define appropriate quantities for the purpose of descriptive modeling. F-IF.7 – Graph functions expressed symbolically and show key features of the graph, by hand in simple case and using technology for more complicated cases. a. graph linear and quadratic functions and show intercepts, maxima, and minima. S-ID.6 – Represent data on two quantitative variable on a scatter plot, and describe how the variables are related. a. Fit a function to the date; use functions fitted to data to solve problems in the context of the data. Use given functions or choose a function suggested by the context. Emphasize linear, quadratic, and exponential models. I Can Statements : I can identify a functions domain, range and end behavior graphically. I can analyze the graph of a function to determine minimum values and maximum values. I can analyze the graph of a function intervals for which the function increases or decreases. I can analyze the graph of a function to determine zeros, positive function values, and negative function values. I can determine a functions end behavior by examining its table of values. I can graph a linear equation on a restricted domain. I can sketch the graph of a function that represents a real-world scenario. I can calculate a functions rate of change. Accommodations for students, both regular and special populations : Extra practice time may be given using InteractMath technology online. One-on-one and/or peer tutoring. Re-take quizzes on which students perform poorly. Unit Vocabulary: function, zero, domain, range, function value, end behavior, interval, maximum/minimum values, average rate of change, absolute value, inequality, solution 1 Daily Agenda Monday Bell-ringer (End Behavior) Notes over Analyzing Characteristics of Function Graphs Guided Practice: Analyze Functions (Domain, Range, End Behavior, Increasing/Decreasing, Minimums/Maximums, Average Rate of Change, Zeros, Positive/Negative Values) Independent Practice (HW) Sketch a graph from a verbal description and analyze Tuesday Bell-ringer: Graph absolute value functions and solve absolute value equations graphically; analyze graph Board Work with Homework Practice graphing linear functions on restricted domains HW: Study bell-ringer activity for Quiz Wednesday Bell-Ringer: Analyze a graph for review Quiz: Analyzing an Absolute Value Graph Notes over Inverses of Functions Guided Practice (mapping diagrams, graphing inverse ordered pairs, finding f-1(x), graphing inverse functions) Independent Practice (HW) Resources, Technology, Formative and/or Summative Assessments, Assignments, and a Daily Activity for citing text based evidence in conversations and/or writing Resources: Integrated Math 2 Text Technology: Desmos Formative Assessment: Bell-Ringer, Observation/Questioning, Assigned Homework Assignments: HW for Lesson 2 Module 2 Resources: Integrated Math 2 Text Technology: Desmos Graphing Formative Assessment: Bell-Ringer, 2.2 Homework, Observation/Questioning Assignments: Study for Quiz Resources: Integrated Math 2 Text, Quiz over Analyzing an Absolute Value Graph Technology: Desmos Graphing (or Geometer’s Sketchpad, if I can get it to work) Formative Assessment: Quiz, questioning/observation during student work Thursday Bell-ringer: Inverse Operations and operations with fractions (Review) Review Inverse Functions Kahoot Review with Homework Practice Modeling Linear Functions and Analyzing Graphs and Finding Inverses of Functions to prepare for assessment Assignments: HW for Lesson 3 Module 1 Resources: Integrated Math 2 Text Technology: Kahoot Formative Assessment: questioning/observation during student work, Kahoot gives Immediate Feedback Assignments: Study for Test Friday Analyzing Functions Assessment Notes over Radicals Alice Activity to explore rational exponents Guided Practice (Practice re-writing rational exponential expressions using radicals) Resources: Integrated Math 2 Text, IMP Year 1 Textbook Summative Assessment: Analyzing Functions Test 2
